| Full name: N-acetyltransferase 10 | Alias Symbol: hALP|FLJ10774|FLJ12179|NET43|KIAA1709|Kre33 | ||
| Type: protein-coding gene | Cytoband: 11p13 | ||
| Entrez ID: 55226 | HGNC ID: HGNC:29830 | Ensembl Gene: ENSG00000135372 | OMIM ID: 609221 |
Screen Evidence:
| |||
Expression of NAT10:
| Dataset | Gene | EntrezID | Probe | Log2FC | Adj.pValue | Expression |
|---|---|---|---|---|---|---|
| GSE17351 | NAT10 | 55226 | 217884_at | 0.6021 | 0.0731 | |
| GSE20347 | NAT10 | 55226 | 217884_at | 0.2186 | 0.1099 | |
| GSE23400 | NAT10 | 55226 | 217884_at | 0.5592 | 0.0000 | |
| GSE26886 | NAT10 | 55226 | 217884_at | 0.5004 | 0.0081 | |
| GSE29001 | NAT10 | 55226 | 217884_at | 0.4410 | 0.0303 | |
| GSE38129 | NAT10 | 55226 | 217884_at | 0.3713 | 0.0042 | |
| GSE45670 | NAT10 | 55226 | 217884_at | 0.4185 | 0.0062 | |
| GSE53622 | NAT10 | 55226 | 54877 | 0.4617 | 0.0000 | |
| GSE53624 | NAT10 | 55226 | 54877 | 0.6331 | 0.0000 | |
| GSE63941 | NAT10 | 55226 | 217884_at | 0.8562 | 0.0219 | |
| GSE77861 | NAT10 | 55226 | 217884_at | 0.3661 | 0.0794 | |
| GSE97050 | NAT10 | 55226 | A_23_P87329 | 0.3898 | 0.2362 | |
| SRP007169 | NAT10 | 55226 | RNAseq | 0.9535 | 0.0068 | |
| SRP008496 | NAT10 | 55226 | RNAseq | 0.7912 | 0.0074 | |
| SRP064894 | NAT10 | 55226 | RNAseq | 0.3069 | 0.0359 | |
| SRP133303 | NAT10 | 55226 | RNAseq | 0.5242 | 0.0024 | |
| SRP159526 | NAT10 | 55226 | RNAseq | 0.3398 | 0.2289 | |
| SRP193095 | NAT10 | 55226 | RNAseq | 0.2980 | 0.0200 | |
| SRP219564 | NAT10 | 55226 | RNAseq | 0.7048 | 0.0646 | |
| TCGA | NAT10 | 55226 | RNAseq | 0.1851 | 0.0005 |
Upregulated datasets: 0; Downregulated datasets: 0.
Survival by NAT10 expression:
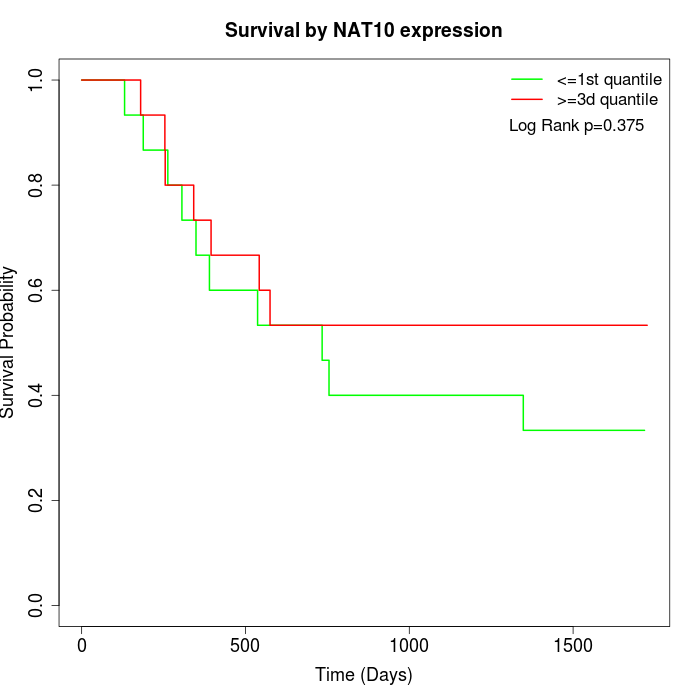 | 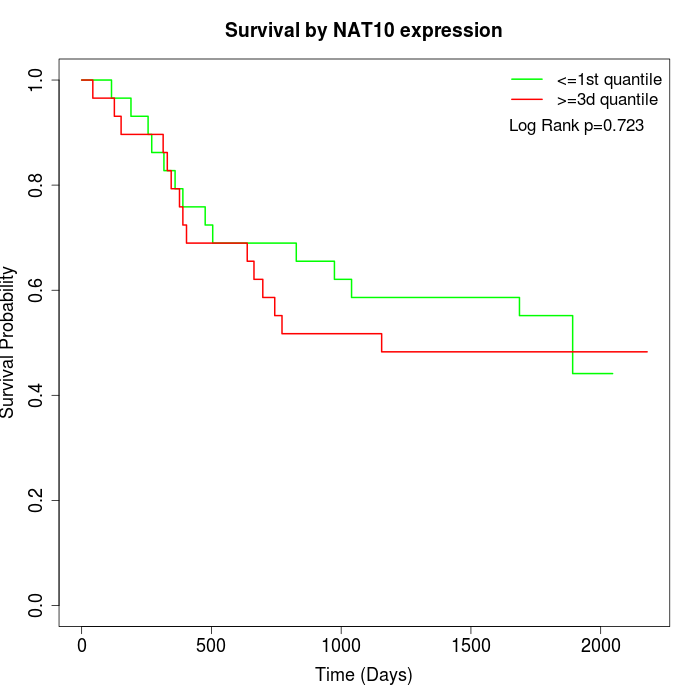 | 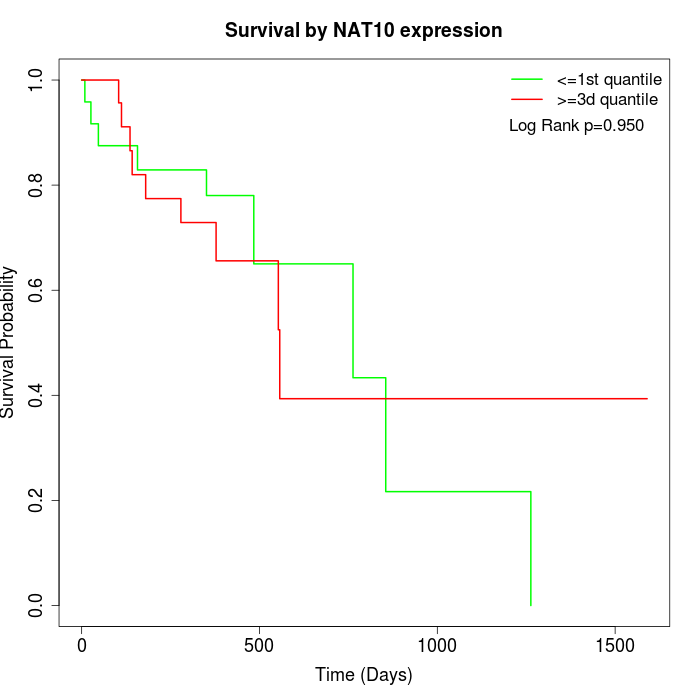 |
| GSE53622 | GSE53624 | TCGA |
Note: Click image to view full size file.
Copy number change of NAT10:
| Dataset | Gene | EntrezID | Gain | Loss | Normal | Detail |
|---|---|---|---|---|---|---|
| GSE15526 | NAT10 | 55226 | 1 | 6 | 23 | |
| GSE20123 | NAT10 | 55226 | 1 | 5 | 24 | |
| GSE43470 | NAT10 | 55226 | 2 | 4 | 37 | |
| GSE46452 | NAT10 | 55226 | 7 | 5 | 47 | |
| GSE47630 | NAT10 | 55226 | 3 | 10 | 27 | |
| GSE54993 | NAT10 | 55226 | 3 | 2 | 65 | |
| GSE54994 | NAT10 | 55226 | 3 | 10 | 40 | |
| GSE60625 | NAT10 | 55226 | 0 | 0 | 11 | |
| GSE74703 | NAT10 | 55226 | 2 | 2 | 32 | |
| GSE74704 | NAT10 | 55226 | 0 | 3 | 17 | |
| TCGA | NAT10 | 55226 | 13 | 24 | 59 |
Total number of gains: 35; Total number of losses: 71; Total Number of normals: 382.
Somatic mutations of NAT10:
Generating mutation plots.
Highly correlated genes for NAT10:
Showing top 20/1591 corelated genes with mean PCC>0.5.
| Gene1 | Gene2 | Mean PCC | Num. Datasets | Num. PCC<0 | Num. PCC>0.5 |
|---|---|---|---|---|---|
| NAT10 | MARS2 | 0.795664 | 3 | 0 | 3 |
| NAT10 | TMEM63B | 0.76997 | 3 | 0 | 3 |
| NAT10 | ZNF680 | 0.76084 | 3 | 0 | 3 |
| NAT10 | DUSP23 | 0.75792 | 3 | 0 | 3 |
| NAT10 | WDR81 | 0.747195 | 3 | 0 | 3 |
| NAT10 | SPNS1 | 0.743041 | 3 | 0 | 3 |
| NAT10 | CMTM4 | 0.738759 | 3 | 0 | 3 |
| NAT10 | ANAPC1 | 0.732661 | 3 | 0 | 3 |
| NAT10 | HDDC3 | 0.730534 | 4 | 0 | 3 |
| NAT10 | RNF26 | 0.728384 | 3 | 0 | 3 |
| NAT10 | AGTRAP | 0.727061 | 3 | 0 | 3 |
| NAT10 | OPLAH | 0.719276 | 3 | 0 | 3 |
| NAT10 | E2F5 | 0.718706 | 4 | 0 | 4 |
| NAT10 | EBNA1BP2 | 0.717506 | 3 | 0 | 3 |
| NAT10 | ZSCAN21 | 0.715658 | 3 | 0 | 3 |
| NAT10 | ARHGEF19 | 0.713642 | 4 | 0 | 3 |
| NAT10 | ZNF707 | 0.713326 | 3 | 0 | 3 |
| NAT10 | DKC1 | 0.712367 | 3 | 0 | 3 |
| NAT10 | KTI12 | 0.711856 | 3 | 0 | 3 |
| NAT10 | NOL10 | 0.711123 | 7 | 0 | 6 |
For details and further investigation, click here