| Full name: natural cytotoxicity triggering receptor 1 | Alias Symbol: NK-p46|NKP46|CD335 | ||
| Type: protein-coding gene | Cytoband: 19q13.42 | ||
| Entrez ID: 9437 | HGNC ID: HGNC:6731 | Ensembl Gene: ENSG00000189430 | OMIM ID: 604530 |
| Drug and gene relationship at DGIdb | |||
NCR1 involved pathways:
| KEGG pathway | Description | View |
|---|---|---|
| hsa04650 | Natural killer cell mediated cytotoxicity |
Expression of NCR1:
| Dataset | Gene | EntrezID | Probe | Log2FC | Adj.pValue | Expression |
|---|---|---|---|---|---|---|
| GSE17351 | NCR1 | 9437 | 217095_x_at | -0.1554 | 0.6093 | |
| GSE20347 | NCR1 | 9437 | 217095_x_at | 0.0593 | 0.6714 | |
| GSE23400 | NCR1 | 9437 | 217095_x_at | -0.1064 | 0.0187 | |
| GSE26886 | NCR1 | 9437 | 217095_x_at | -0.0202 | 0.9158 | |
| GSE29001 | NCR1 | 9437 | 217095_x_at | -0.1461 | 0.3810 | |
| GSE38129 | NCR1 | 9437 | 217095_x_at | -0.0823 | 0.4641 | |
| GSE45670 | NCR1 | 9437 | 217095_x_at | -0.0014 | 0.9912 | |
| GSE53622 | NCR1 | 9437 | 42877 | -2.7147 | 0.0000 | |
| GSE53624 | NCR1 | 9437 | 42877 | -2.7821 | 0.0000 | |
| GSE63941 | NCR1 | 9437 | 217095_x_at | 0.1358 | 0.4896 | |
| GSE77861 | NCR1 | 9437 | 217095_x_at | -0.0524 | 0.5870 | |
| GSE97050 | NCR1 | 9437 | A_33_P3571824 | -0.7932 | 0.1867 | |
| TCGA | NCR1 | 9437 | RNAseq | 0.9068 | 0.2276 |
Upregulated datasets: 0; Downregulated datasets: 2.
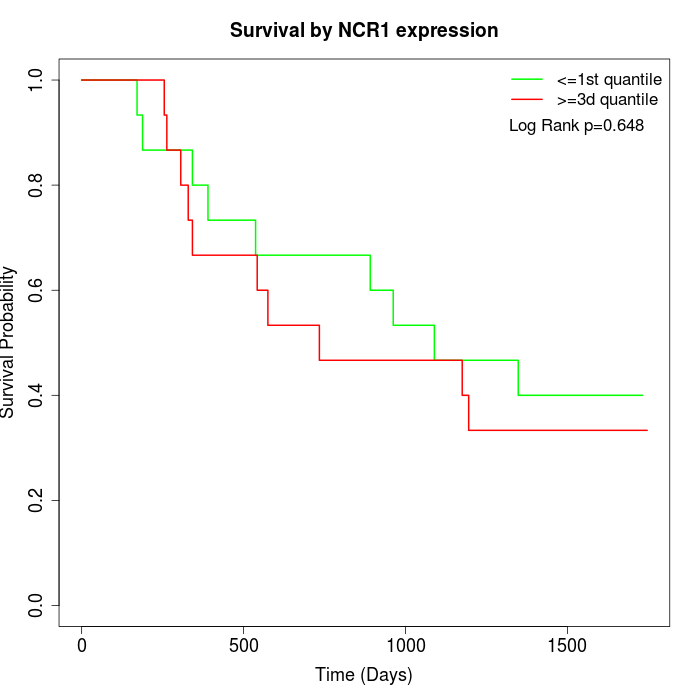
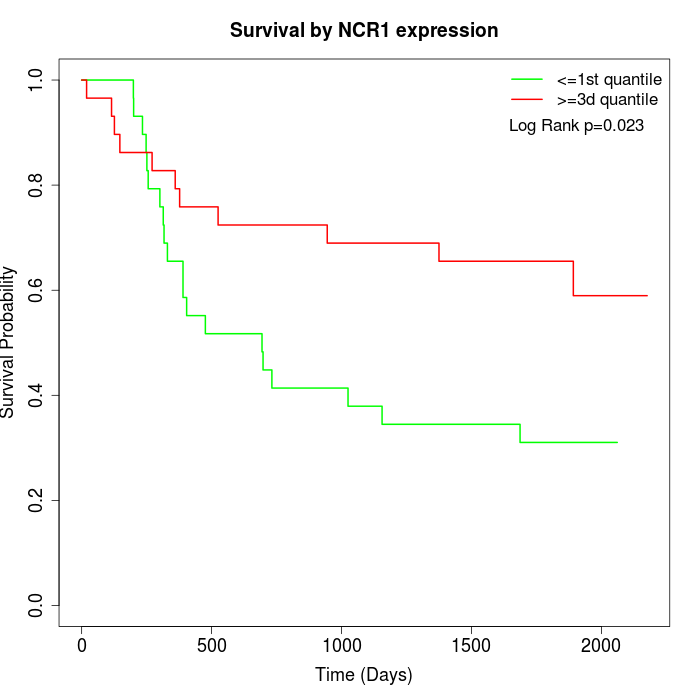
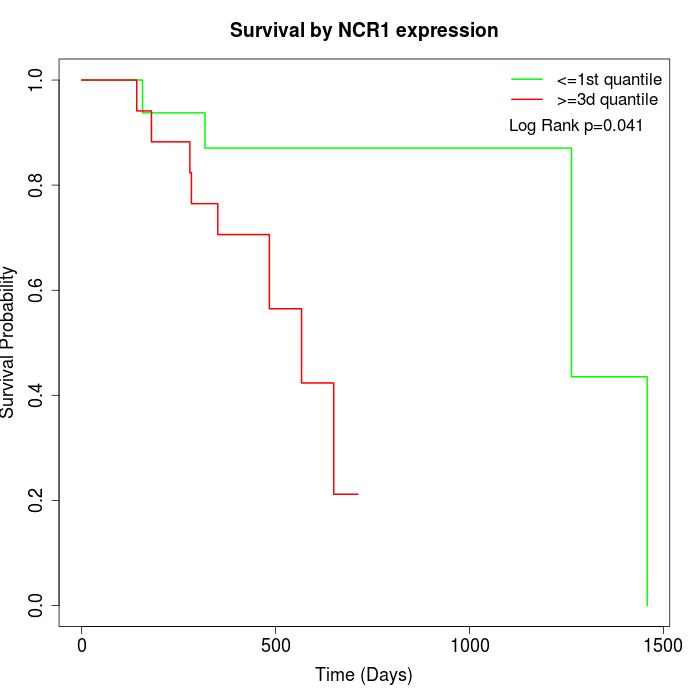
Survival by NCR1 expression:
Note: Click image to view full size file.
Copy number change of NCR1:
| Dataset | Gene | EntrezID | Gain | Loss | Normal | Detail |
|---|---|---|---|---|---|---|
| GSE15526 | NCR1 | 9437 | 3 | 4 | 23 | |
| GSE20123 | NCR1 | 9437 | 3 | 3 | 24 | |
| GSE43470 | NCR1 | 9437 | 3 | 11 | 29 | |
| GSE46452 | NCR1 | 9437 | 45 | 1 | 13 | |
| GSE47630 | NCR1 | 9437 | 8 | 6 | 26 | |
| GSE54993 | NCR1 | 9437 | 17 | 4 | 49 | |
| GSE54994 | NCR1 | 9437 | 4 | 13 | 36 | |
| GSE60625 | NCR1 | 9437 | 9 | 0 | 2 | |
| GSE74703 | NCR1 | 9437 | 3 | 7 | 26 | |
| GSE74704 | NCR1 | 9437 | 3 | 1 | 16 | |
| TCGA | NCR1 | 9437 | 19 | 14 | 63 |
Total number of gains: 117; Total number of losses: 64; Total Number of normals: 307.
Somatic mutations of NCR1:
Generating mutation plots.
Highly correlated genes for NCR1:
Showing top 20/1241 corelated genes with mean PCC>0.5.
| Gene1 | Gene2 | Mean PCC | Num. Datasets | Num. PCC<0 | Num. PCC>0.5 |
|---|---|---|---|---|---|
| NCR1 | PRSS27 | 0.908129 | 3 | 0 | 3 |
| NCR1 | SPINK7 | 0.904069 | 3 | 0 | 3 |
| NCR1 | DEGS2 | 0.899362 | 3 | 0 | 3 |
| NCR1 | KRTAP20-1 | 0.898983 | 3 | 0 | 3 |
| NCR1 | SCEL | 0.897884 | 3 | 0 | 3 |
| NCR1 | OR2Z1 | 0.893629 | 3 | 0 | 3 |
| NCR1 | VSIG10L | 0.893226 | 3 | 0 | 3 |
| NCR1 | NCCRP1 | 0.892765 | 3 | 0 | 3 |
| NCR1 | FAM163B | 0.877787 | 3 | 0 | 3 |
| NCR1 | SPINK5 | 0.874995 | 3 | 0 | 3 |
| NCR1 | KRT4 | 0.873274 | 3 | 0 | 3 |
| NCR1 | RHCG | 0.871038 | 3 | 0 | 3 |
| NCR1 | MFSD2B | 0.866561 | 3 | 0 | 3 |
| NCR1 | MAL | 0.862124 | 3 | 0 | 3 |
| NCR1 | CLCA4 | 0.860029 | 3 | 0 | 3 |
| NCR1 | OR10G8 | 0.856469 | 3 | 0 | 3 |
| NCR1 | ECM1 | 0.852079 | 3 | 0 | 3 |
| NCR1 | TMPRSS11E | 0.846267 | 3 | 0 | 3 |
| NCR1 | CNFN | 0.843872 | 3 | 0 | 3 |
| NCR1 | OTOP3 | 0.843844 | 3 | 0 | 3 |
For details and further investigation, click here


