| Full name: neuronal PAS domain protein 3 | Alias Symbol: MOP6|PASD6|bHLHe12 | ||
| Type: protein-coding gene | Cytoband: 14q13.1 | ||
| Entrez ID: 64067 | HGNC ID: HGNC:19311 | Ensembl Gene: ENSG00000151322 | OMIM ID: 609430 |
Expression of NPAS3:
| Dataset | Gene | EntrezID | Probe | Log2FC | Adj.pValue | Expression |
|---|---|---|---|---|---|---|
| GSE17351 | NPAS3 | 64067 | 1554635_a_at | -0.1300 | 0.6858 | |
| GSE20347 | NPAS3 | 64067 | 220316_at | 0.0509 | 0.4798 | |
| GSE23400 | NPAS3 | 64067 | 220316_at | -0.1095 | 0.0010 | |
| GSE26886 | NPAS3 | 64067 | 1554635_a_at | -0.1889 | 0.1058 | |
| GSE29001 | NPAS3 | 64067 | 220316_at | 0.0703 | 0.8199 | |
| GSE38129 | NPAS3 | 64067 | 220316_at | -0.1319 | 0.1011 | |
| GSE45670 | NPAS3 | 64067 | 1554635_a_at | -0.0293 | 0.8226 | |
| GSE53622 | NPAS3 | 64067 | 136418 | -0.6099 | 0.0005 | |
| GSE53624 | NPAS3 | 64067 | 136418 | -0.2059 | 0.0691 | |
| GSE63941 | NPAS3 | 64067 | 1554635_a_at | 0.0582 | 0.7256 | |
| GSE77861 | NPAS3 | 64067 | 220316_at | -0.0466 | 0.6539 | |
| GSE97050 | NPAS3 | 64067 | A_23_P2942 | -0.3480 | 0.3280 | |
| SRP133303 | NPAS3 | 64067 | RNAseq | -0.4915 | 0.0564 | |
| SRP219564 | NPAS3 | 64067 | RNAseq | -0.3674 | 0.6013 | |
| TCGA | NPAS3 | 64067 | RNAseq | -0.8477 | 0.0163 |
Upregulated datasets: 0; Downregulated datasets: 0.
Survival by NPAS3 expression:
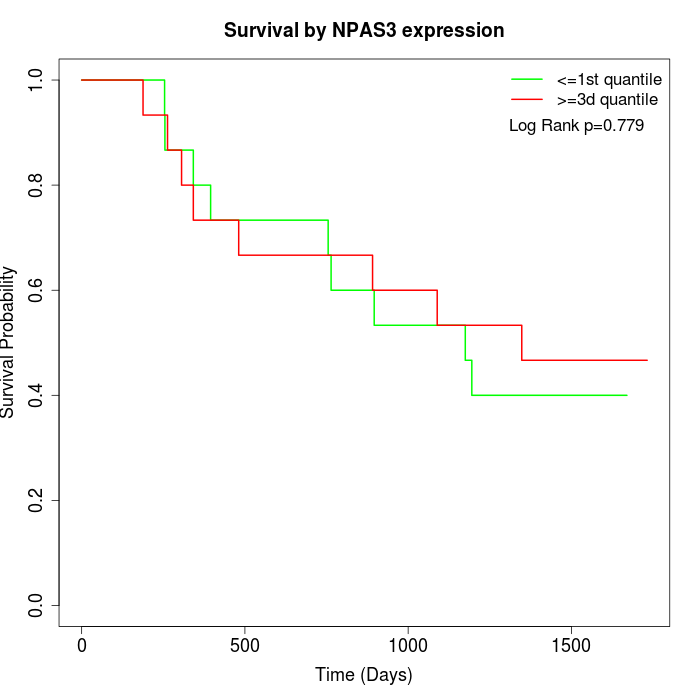 | 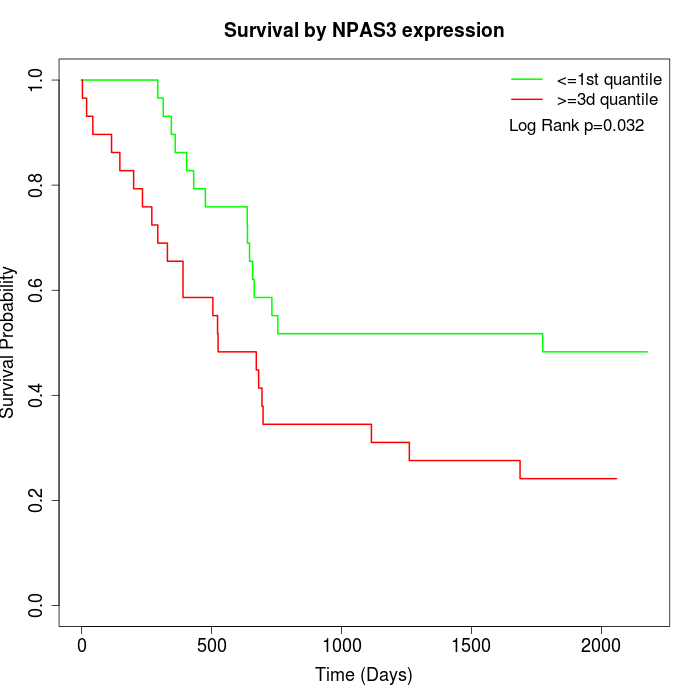 | 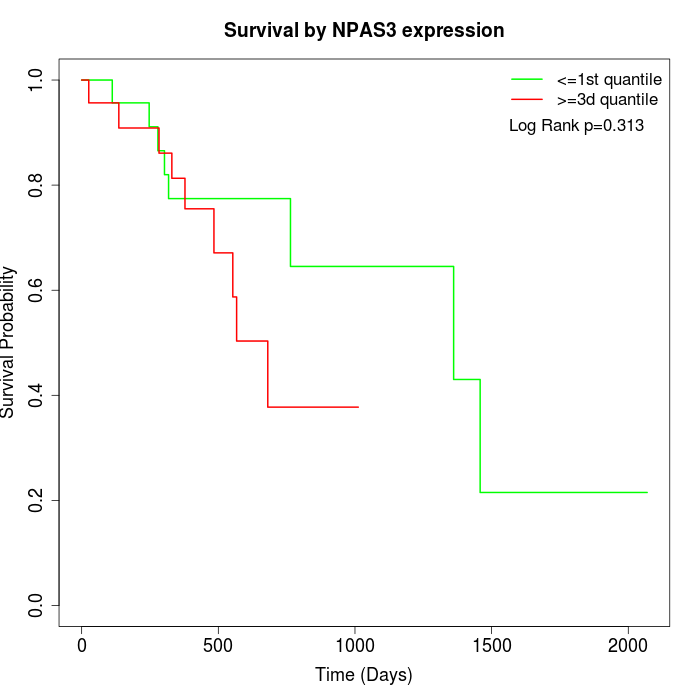 |
| GSE53622 | GSE53624 | TCGA |
Note: Click image to view full size file.
Copy number change of NPAS3:
| Dataset | Gene | EntrezID | Gain | Loss | Normal | Detail |
|---|---|---|---|---|---|---|
| GSE15526 | NPAS3 | 64067 | 11 | 3 | 16 | |
| GSE20123 | NPAS3 | 64067 | 11 | 3 | 16 | |
| GSE43470 | NPAS3 | 64067 | 9 | 2 | 32 | |
| GSE46452 | NPAS3 | 64067 | 18 | 2 | 39 | |
| GSE47630 | NPAS3 | 64067 | 11 | 10 | 19 | |
| GSE54993 | NPAS3 | 64067 | 3 | 11 | 56 | |
| GSE54994 | NPAS3 | 64067 | 19 | 5 | 29 | |
| GSE60625 | NPAS3 | 64067 | 0 | 2 | 9 | |
| GSE74703 | NPAS3 | 64067 | 8 | 2 | 26 | |
| GSE74704 | NPAS3 | 64067 | 5 | 2 | 13 | |
| TCGA | NPAS3 | 64067 | 35 | 15 | 46 |
Total number of gains: 130; Total number of losses: 57; Total Number of normals: 301.
Somatic mutations of NPAS3:
Generating mutation plots.
Highly correlated genes for NPAS3:
Showing top 20/229 corelated genes with mean PCC>0.5.
| Gene1 | Gene2 | Mean PCC | Num. Datasets | Num. PCC<0 | Num. PCC>0.5 |
|---|---|---|---|---|---|
| NPAS3 | RPS6KL1 | 0.690867 | 3 | 0 | 3 |
| NPAS3 | GLIS1 | 0.665884 | 3 | 0 | 3 |
| NPAS3 | USP7 | 0.661559 | 3 | 0 | 3 |
| NPAS3 | RASSF2 | 0.654895 | 4 | 0 | 3 |
| NPAS3 | ZNF483 | 0.651886 | 5 | 0 | 3 |
| NPAS3 | ISYNA1 | 0.623045 | 4 | 0 | 3 |
| NPAS3 | ABCA2 | 0.619303 | 5 | 0 | 5 |
| NPAS3 | MYOM3 | 0.617342 | 3 | 0 | 3 |
| NPAS3 | C1orf105 | 0.616741 | 3 | 0 | 3 |
| NPAS3 | ATOH8 | 0.608886 | 7 | 0 | 4 |
| NPAS3 | NACAD | 0.606111 | 5 | 0 | 4 |
| NPAS3 | GPM6A | 0.605962 | 4 | 0 | 4 |
| NPAS3 | ADAMTSL3 | 0.6035 | 6 | 0 | 4 |
| NPAS3 | LMOD2 | 0.600756 | 4 | 0 | 4 |
| NPAS3 | CACNA1H | 0.598946 | 5 | 0 | 3 |
| NPAS3 | SLC8A1 | 0.597812 | 6 | 0 | 6 |
| NPAS3 | ZNF280A | 0.596939 | 6 | 0 | 3 |
| NPAS3 | CORO2B | 0.593297 | 7 | 0 | 5 |
| NPAS3 | FAM184A | 0.592796 | 8 | 0 | 4 |
| NPAS3 | HAUS5 | 0.59149 | 3 | 0 | 3 |
For details and further investigation, click here