| Full name: olfactory receptor family 1 subfamily A member 2 | Alias Symbol: OR17-6 | ||
| Type: protein-coding gene | Cytoband: 17p13.3 | ||
| Entrez ID: 26189 | HGNC ID: HGNC:8180 | Ensembl Gene: ENSG00000172150 | OMIM ID: 618047 |
OR1A2 involved pathways:
| KEGG pathway | Description | View |
|---|---|---|
| hsa04740 | Olfactory transduction |
Expression of OR1A2:
| Dataset | Gene | EntrezID | Probe | Log2FC | Adj.pValue | Expression |
|---|---|---|---|---|---|---|
| GSE17351 | OR1A2 | 26189 | 221445_at | -0.1019 | 0.6858 | |
| GSE20347 | OR1A2 | 26189 | 221445_at | -0.0533 | 0.2893 | |
| GSE23400 | OR1A2 | 26189 | 221445_at | -0.0703 | 0.0730 | |
| GSE26886 | OR1A2 | 26189 | 221445_at | -0.1360 | 0.1197 | |
| GSE29001 | OR1A2 | 26189 | 221445_at | -0.2354 | 0.1715 | |
| GSE38129 | OR1A2 | 26189 | 221445_at | -0.0951 | 0.0501 | |
| GSE45670 | OR1A2 | 26189 | 221445_at | -0.0095 | 0.9287 | |
| GSE53622 | OR1A2 | 26189 | 52955 | 0.6805 | 0.0001 | |
| GSE53624 | OR1A2 | 26189 | 52955 | 0.2102 | 0.1841 | |
| GSE63941 | OR1A2 | 26189 | 221445_at | 0.0853 | 0.5884 | |
| GSE77861 | OR1A2 | 26189 | 221445_at | -0.1478 | 0.1000 |
Upregulated datasets: 0; Downregulated datasets: 0.
Survival by OR1A2 expression:
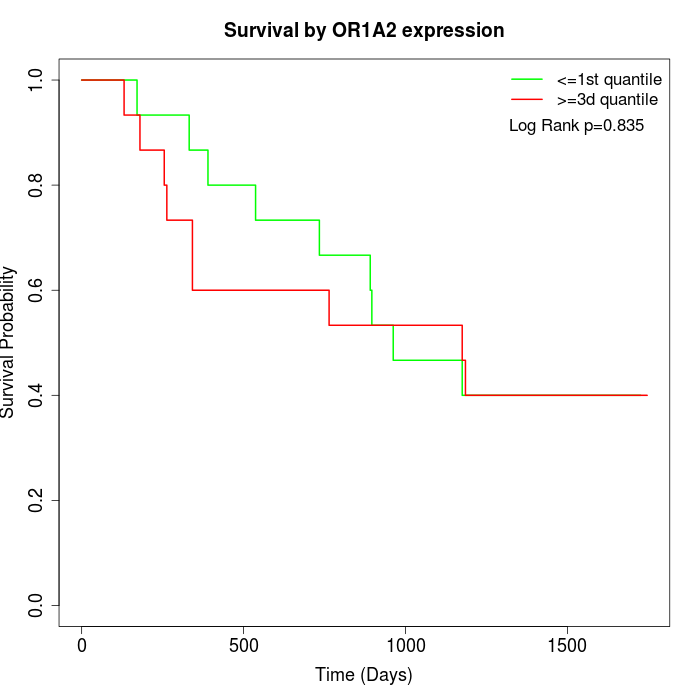 | 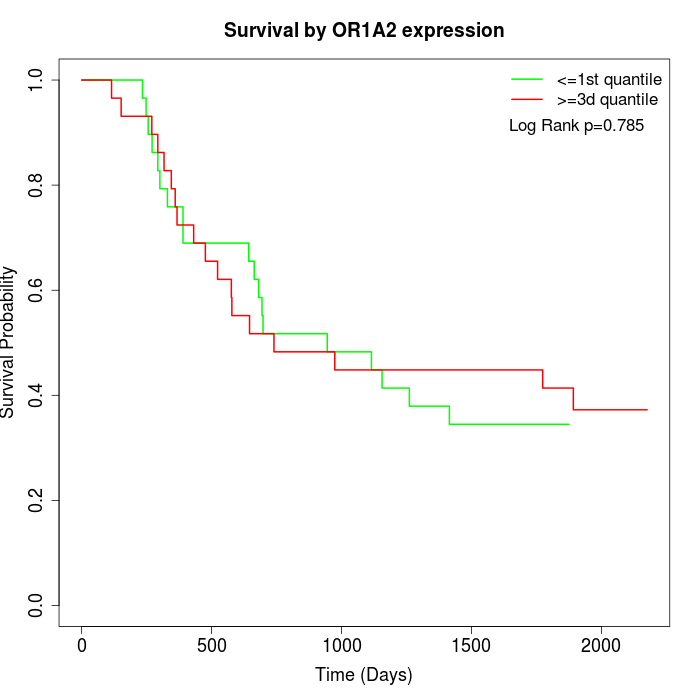 | 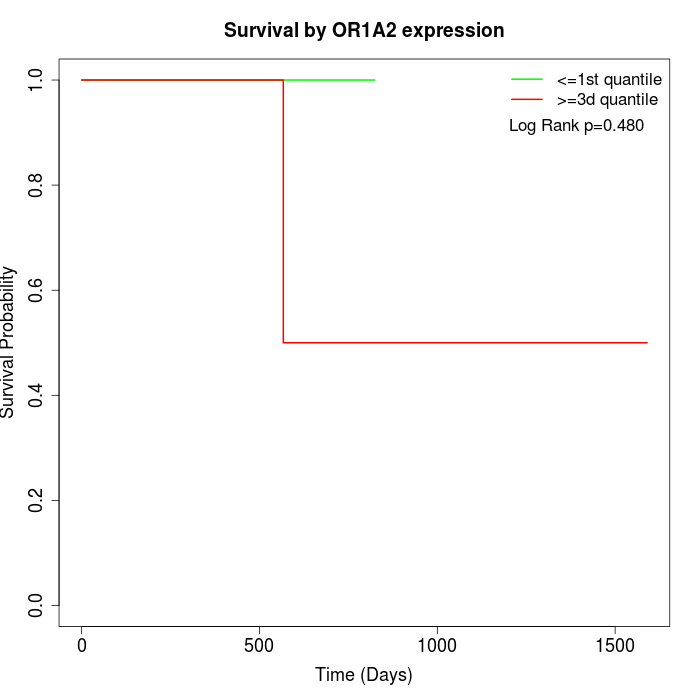 |
| GSE53622 | GSE53624 | TCGA |
Note: Click image to view full size file.
Copy number change of OR1A2:
| Dataset | Gene | EntrezID | Gain | Loss | Normal | Detail |
|---|---|---|---|---|---|---|
| GSE15526 | OR1A2 | 26189 | 5 | 2 | 23 | |
| GSE20123 | OR1A2 | 26189 | 5 | 3 | 22 | |
| GSE43470 | OR1A2 | 26189 | 1 | 6 | 36 | |
| GSE46452 | OR1A2 | 26189 | 34 | 1 | 24 | |
| GSE47630 | OR1A2 | 26189 | 7 | 1 | 32 | |
| GSE54993 | OR1A2 | 26189 | 4 | 3 | 63 | |
| GSE54994 | OR1A2 | 26189 | 5 | 9 | 39 | |
| GSE60625 | OR1A2 | 26189 | 4 | 0 | 7 | |
| GSE74703 | OR1A2 | 26189 | 1 | 3 | 32 | |
| GSE74704 | OR1A2 | 26189 | 3 | 1 | 16 | |
| TCGA | OR1A2 | 26189 | 16 | 21 | 59 |
Total number of gains: 85; Total number of losses: 50; Total Number of normals: 353.
Somatic mutations of OR1A2:
Generating mutation plots.
Highly correlated genes for OR1A2:
Showing top 20/446 corelated genes with mean PCC>0.5.
| Gene1 | Gene2 | Mean PCC | Num. Datasets | Num. PCC<0 | Num. PCC>0.5 |
|---|---|---|---|---|---|
| OR1A2 | TTLL6 | 0.700613 | 3 | 0 | 3 |
| OR1A2 | UBQLN3 | 0.675707 | 4 | 0 | 4 |
| OR1A2 | PHLDB1 | 0.674173 | 6 | 0 | 5 |
| OR1A2 | CELF3 | 0.663904 | 4 | 0 | 3 |
| OR1A2 | DLGAP2-AS1 | 0.660266 | 3 | 0 | 3 |
| OR1A2 | ALPI | 0.652956 | 4 | 0 | 4 |
| OR1A2 | CYP2A7 | 0.65152 | 5 | 0 | 5 |
| OR1A2 | TM4SF4 | 0.641761 | 4 | 0 | 3 |
| OR1A2 | TMEM105 | 0.637479 | 3 | 0 | 3 |
| OR1A2 | KCNK3 | 0.6365 | 4 | 0 | 4 |
| OR1A2 | IFNA17 | 0.628933 | 4 | 0 | 4 |
| OR1A2 | KISS1 | 0.628906 | 3 | 0 | 3 |
| OR1A2 | OR2H2 | 0.624648 | 5 | 0 | 4 |
| OR1A2 | BTNL3 | 0.621602 | 6 | 0 | 5 |
| OR1A2 | LECT2 | 0.620091 | 4 | 0 | 4 |
| OR1A2 | LINC00896 | 0.619562 | 3 | 0 | 3 |
| OR1A2 | VWA7 | 0.615461 | 5 | 0 | 4 |
| OR1A2 | FGF23 | 0.614752 | 7 | 0 | 6 |
| OR1A2 | LBP | 0.614348 | 6 | 0 | 5 |
| OR1A2 | KRTAP1-1 | 0.613469 | 5 | 0 | 4 |
For details and further investigation, click here