| Full name: olfactory receptor family 1 subfamily D member 2 | Alias Symbol: OR17-4 | ||
| Type: protein-coding gene | Cytoband: 17p13.3 | ||
| Entrez ID: 4991 | HGNC ID: HGNC:8183 | Ensembl Gene: ENSG00000184166 | OMIM ID: 164342 |
OR1D2 involved pathways:
| KEGG pathway | Description | View |
|---|---|---|
| hsa04740 | Olfactory transduction |
Expression of OR1D2:
| Dataset | Gene | EntrezID | Probe | Log2FC | Adj.pValue | Expression |
|---|---|---|---|---|---|---|
| GSE17351 | OR1D2 | 4991 | 221464_at | -0.1743 | 0.5683 | |
| GSE20347 | OR1D2 | 4991 | 221464_at | -0.1841 | 0.0111 | |
| GSE23400 | OR1D2 | 4991 | 221464_at | -0.2047 | 0.0000 | |
| GSE26886 | OR1D2 | 4991 | 221464_at | -0.1961 | 0.0897 | |
| GSE29001 | OR1D2 | 4991 | 221464_at | -0.3341 | 0.0447 | |
| GSE38129 | OR1D2 | 4991 | 221464_at | -0.3544 | 0.0000 | |
| GSE45670 | OR1D2 | 4991 | 221464_at | -0.0716 | 0.4514 | |
| GSE53622 | OR1D2 | 4991 | 52126 | 0.2671 | 0.0135 | |
| GSE53624 | OR1D2 | 4991 | 52126 | 0.6467 | 0.0000 | |
| GSE63941 | OR1D2 | 4991 | 221464_at | 0.2752 | 0.1346 | |
| GSE77861 | OR1D2 | 4991 | 221464_at | -0.1466 | 0.2314 |
Upregulated datasets: 0; Downregulated datasets: 0.
Survival by OR1D2 expression:
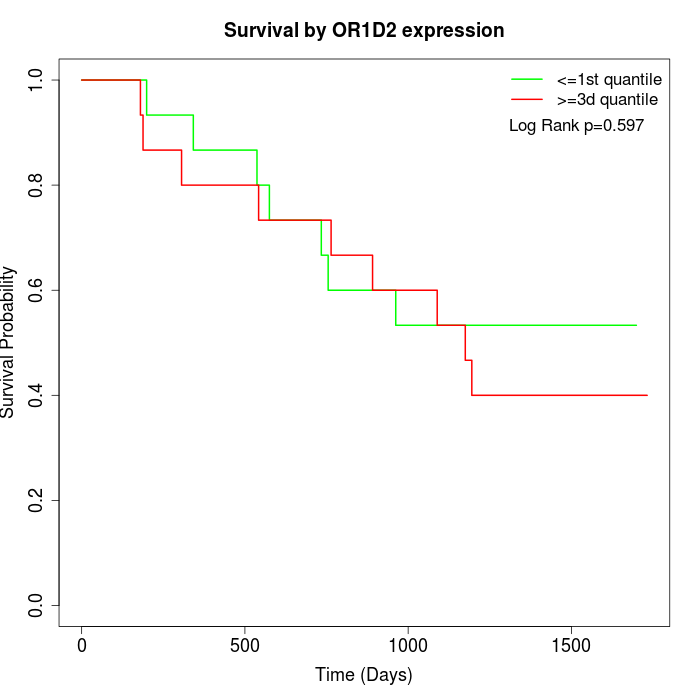 | 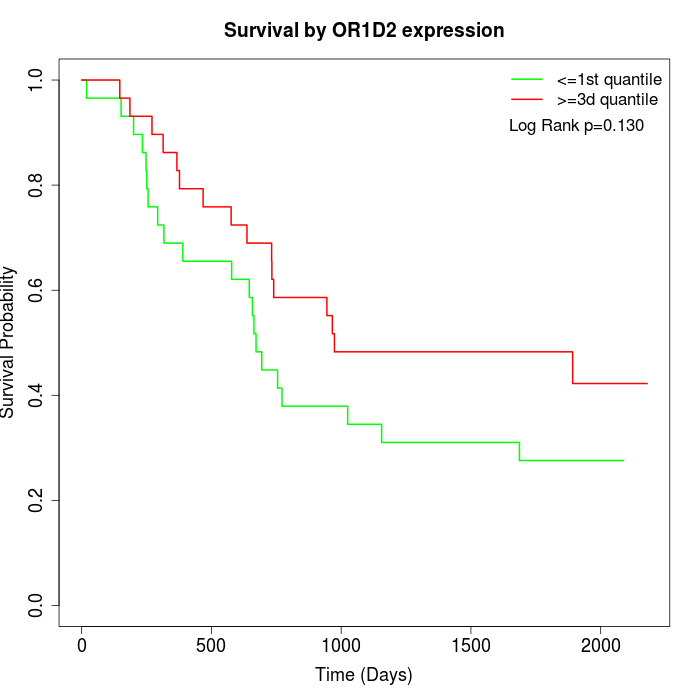 | 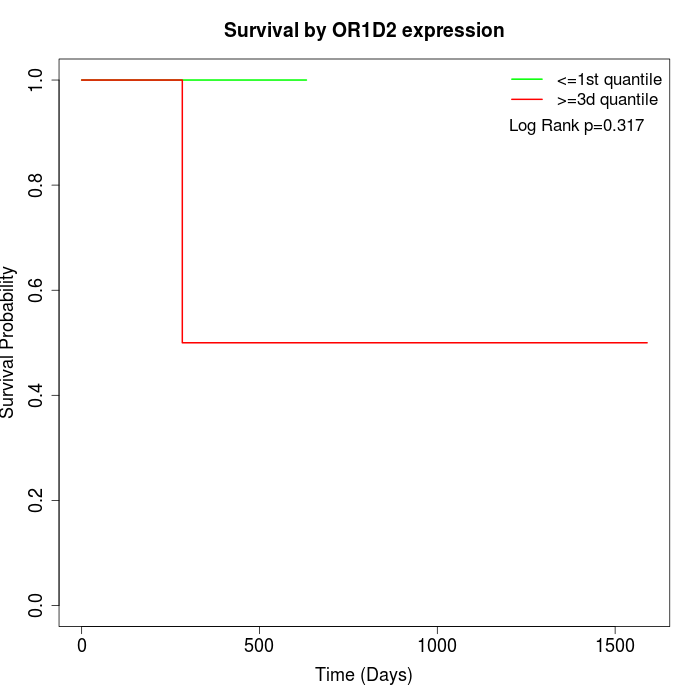 |
| GSE53622 | GSE53624 | TCGA |
Note: Click image to view full size file.
Copy number change of OR1D2:
| Dataset | Gene | EntrezID | Gain | Loss | Normal | Detail |
|---|---|---|---|---|---|---|
| GSE15526 | OR1D2 | 4991 | 5 | 2 | 23 | |
| GSE20123 | OR1D2 | 4991 | 5 | 3 | 22 | |
| GSE43470 | OR1D2 | 4991 | 1 | 6 | 36 | |
| GSE46452 | OR1D2 | 4991 | 34 | 1 | 24 | |
| GSE47630 | OR1D2 | 4991 | 7 | 1 | 32 | |
| GSE54993 | OR1D2 | 4991 | 4 | 3 | 63 | |
| GSE54994 | OR1D2 | 4991 | 5 | 9 | 39 | |
| GSE60625 | OR1D2 | 4991 | 4 | 0 | 7 | |
| GSE74703 | OR1D2 | 4991 | 1 | 3 | 32 | |
| GSE74704 | OR1D2 | 4991 | 3 | 1 | 16 | |
| TCGA | OR1D2 | 4991 | 16 | 21 | 59 |
Total number of gains: 85; Total number of losses: 50; Total Number of normals: 353.
Somatic mutations of OR1D2:
Generating mutation plots.
Highly correlated genes for OR1D2:
Showing top 20/824 corelated genes with mean PCC>0.5.
| Gene1 | Gene2 | Mean PCC | Num. Datasets | Num. PCC<0 | Num. PCC>0.5 |
|---|---|---|---|---|---|
| OR1D2 | PHLDB1 | 0.740366 | 6 | 0 | 6 |
| OR1D2 | SYT2 | 0.716882 | 6 | 0 | 6 |
| OR1D2 | GJB4 | 0.694446 | 6 | 0 | 6 |
| OR1D2 | GUCA1B | 0.690696 | 4 | 0 | 4 |
| OR1D2 | CRYBB1 | 0.686613 | 4 | 0 | 4 |
| OR1D2 | RAPGEF3 | 0.685125 | 4 | 0 | 4 |
| OR1D2 | NR1H4 | 0.67599 | 4 | 0 | 4 |
| OR1D2 | TNFSF11 | 0.672547 | 5 | 0 | 5 |
| OR1D2 | OR11A1 | 0.670727 | 4 | 0 | 3 |
| OR1D2 | PIK3R5 | 0.670402 | 4 | 0 | 4 |
| OR1D2 | GPR37L1 | 0.669585 | 5 | 0 | 5 |
| OR1D2 | FSCN3 | 0.665537 | 5 | 0 | 4 |
| OR1D2 | BTNL3 | 0.662376 | 5 | 0 | 4 |
| OR1D2 | HLA-DOA | 0.661233 | 4 | 0 | 4 |
| OR1D2 | GFRA2 | 0.660733 | 5 | 0 | 5 |
| OR1D2 | SLC22A14 | 0.660066 | 7 | 0 | 6 |
| OR1D2 | KIAA1614 | 0.659348 | 4 | 0 | 4 |
| OR1D2 | PSG1 | 0.658186 | 6 | 0 | 5 |
| OR1D2 | FOXN3-AS2 | 0.657872 | 5 | 0 | 5 |
| OR1D2 | MYO3A | 0.656939 | 4 | 0 | 4 |
For details and further investigation, click here