| Full name: poly(A) specific ribonuclease subunit PAN2 | Alias Symbol: KIAA0710|hPAN2 | ||
| Type: protein-coding gene | Cytoband: 12q13.3 | ||
| Entrez ID: 9924 | HGNC ID: HGNC:20074 | Ensembl Gene: ENSG00000135473 | OMIM ID: 617447 |
Screen Evidence:
| |||
Expression of PAN2:
| Dataset | Gene | EntrezID | Probe | Log2FC | Adj.pValue | Expression |
|---|---|---|---|---|---|---|
| GSE17351 | PAN2 | 9924 | 203117_s_at | 0.0220 | 0.9730 | |
| GSE20347 | PAN2 | 9924 | 203117_s_at | 0.5916 | 0.0019 | |
| GSE23400 | PAN2 | 9924 | 203117_s_at | 0.2433 | 0.0002 | |
| GSE26886 | PAN2 | 9924 | 203117_s_at | 0.0550 | 0.8605 | |
| GSE29001 | PAN2 | 9924 | 203117_s_at | 0.2980 | 0.3694 | |
| GSE38129 | PAN2 | 9924 | 203117_s_at | 0.4816 | 0.0011 | |
| GSE45670 | PAN2 | 9924 | 203117_s_at | -0.0210 | 0.9307 | |
| GSE53622 | PAN2 | 9924 | 90654 | 0.3235 | 0.0001 | |
| GSE53624 | PAN2 | 9924 | 90654 | 0.2170 | 0.0147 | |
| GSE63941 | PAN2 | 9924 | 203117_s_at | 0.8308 | 0.0383 | |
| GSE77861 | PAN2 | 9924 | 203117_s_at | 0.4038 | 0.1505 | |
| GSE97050 | PAN2 | 9924 | A_23_P64689 | 0.0921 | 0.7518 | |
| SRP007169 | PAN2 | 9924 | RNAseq | 0.4592 | 0.2247 | |
| SRP008496 | PAN2 | 9924 | RNAseq | 0.4042 | 0.1519 | |
| SRP064894 | PAN2 | 9924 | RNAseq | 0.1788 | 0.4044 | |
| SRP133303 | PAN2 | 9924 | RNAseq | -0.0269 | 0.8999 | |
| SRP159526 | PAN2 | 9924 | RNAseq | 0.3850 | 0.3017 | |
| SRP193095 | PAN2 | 9924 | RNAseq | 0.3214 | 0.0492 | |
| SRP219564 | PAN2 | 9924 | RNAseq | -0.1185 | 0.6676 | |
| TCGA | PAN2 | 9924 | RNAseq | -0.0711 | 0.2361 |
Upregulated datasets: 0; Downregulated datasets: 0.
Survival by PAN2 expression:
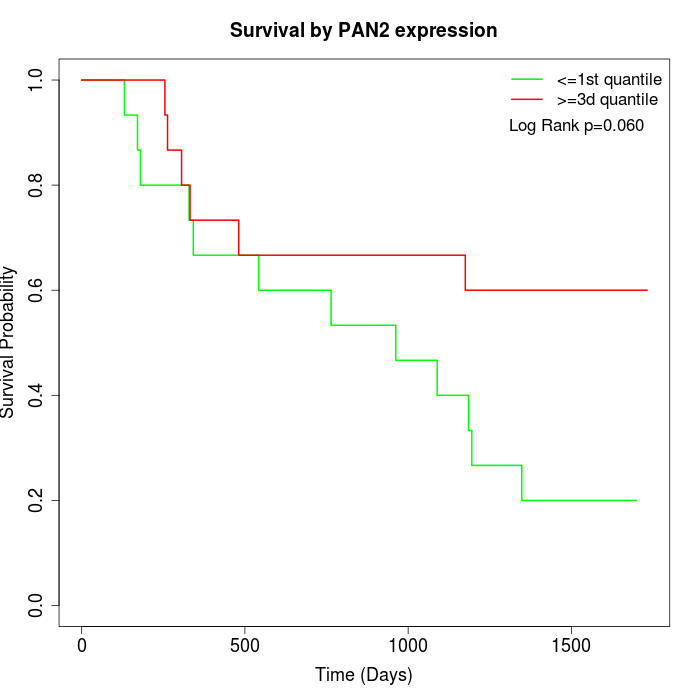 | 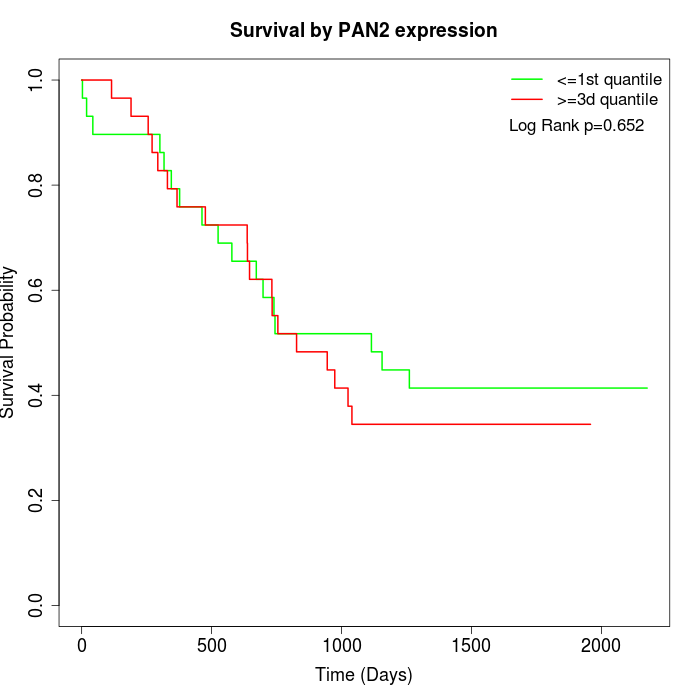 | 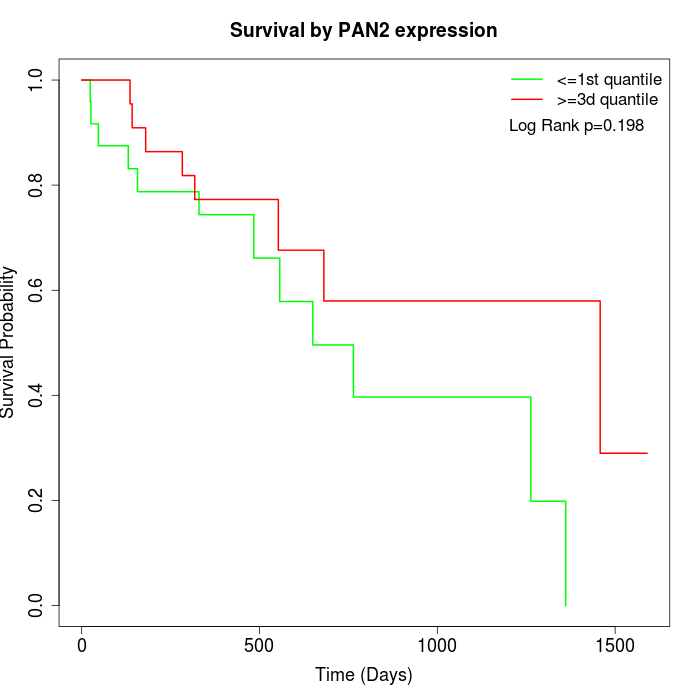 |
| GSE53622 | GSE53624 | TCGA |
Note: Click image to view full size file.
Copy number change of PAN2:
| Dataset | Gene | EntrezID | Gain | Loss | Normal | Detail |
|---|---|---|---|---|---|---|
| GSE15526 | PAN2 | 9924 | 7 | 2 | 21 | |
| GSE20123 | PAN2 | 9924 | 7 | 1 | 22 | |
| GSE43470 | PAN2 | 9924 | 4 | 0 | 39 | |
| GSE46452 | PAN2 | 9924 | 8 | 1 | 50 | |
| GSE47630 | PAN2 | 9924 | 10 | 2 | 28 | |
| GSE54993 | PAN2 | 9924 | 0 | 5 | 65 | |
| GSE54994 | PAN2 | 9924 | 4 | 1 | 48 | |
| GSE60625 | PAN2 | 9924 | 0 | 0 | 11 | |
| GSE74703 | PAN2 | 9924 | 4 | 0 | 32 | |
| GSE74704 | PAN2 | 9924 | 4 | 1 | 15 | |
| TCGA | PAN2 | 9924 | 14 | 10 | 72 |
Total number of gains: 62; Total number of losses: 23; Total Number of normals: 403.
Somatic mutations of PAN2:
Generating mutation plots.
Highly correlated genes for PAN2:
Showing top 20/599 corelated genes with mean PCC>0.5.
| Gene1 | Gene2 | Mean PCC | Num. Datasets | Num. PCC<0 | Num. PCC>0.5 |
|---|---|---|---|---|---|
| PAN2 | PLEKHH1 | 0.80396 | 3 | 0 | 3 |
| PAN2 | RPS24 | 0.795331 | 3 | 0 | 3 |
| PAN2 | SLC25A37 | 0.782523 | 3 | 0 | 3 |
| PAN2 | NPNT | 0.773999 | 3 | 0 | 3 |
| PAN2 | SORL1 | 0.748385 | 4 | 0 | 3 |
| PAN2 | ZNF830 | 0.746615 | 3 | 0 | 3 |
| PAN2 | CENPV | 0.744407 | 4 | 0 | 4 |
| PAN2 | TTLL1 | 0.743587 | 3 | 0 | 3 |
| PAN2 | UTP23 | 0.731089 | 3 | 0 | 3 |
| PAN2 | CDCA7 | 0.725462 | 3 | 0 | 3 |
| PAN2 | ZBTB11 | 0.723726 | 3 | 0 | 3 |
| PAN2 | DUSP16 | 0.718376 | 3 | 0 | 3 |
| PAN2 | GPHN | 0.715342 | 3 | 0 | 3 |
| PAN2 | NPAT | 0.714072 | 3 | 0 | 3 |
| PAN2 | NOL11 | 0.71297 | 3 | 0 | 3 |
| PAN2 | PTPRF | 0.712828 | 3 | 0 | 3 |
| PAN2 | SRSF11 | 0.712008 | 3 | 0 | 3 |
| PAN2 | TSHZ1 | 0.704778 | 4 | 0 | 4 |
| PAN2 | CPNE2 | 0.703147 | 3 | 0 | 3 |
| PAN2 | COG8 | 0.70131 | 3 | 0 | 3 |
For details and further investigation, click here