| Full name: protein tyrosine phosphatase receptor type F | Alias Symbol: | ||
| Type: protein-coding gene | Cytoband: 1p34.2 | ||
| Entrez ID: 5792 | HGNC ID: HGNC:9670 | Ensembl Gene: ENSG00000142949 | OMIM ID: 179590 |
| Related drugs: ERLOTINIB HYDROCHLORIDE, ILLUDALIC ACID... [more] | |||
PTPRF involved pathways:
| KEGG pathway | Description | View |
|---|---|---|
| hsa04520 | Adherens junction | |
| hsa04910 | Insulin signaling pathway | |
| hsa04931 | Insulin resistance |
Expression of PTPRF:
| Dataset | Gene | EntrezID | Probe | Log2FC | Adj.pValue | Expression |
|---|---|---|---|---|---|---|
| GSE17351 | PTPRF | 5792 | 200636_s_at | 0.4197 | 0.5043 | |
| GSE20347 | PTPRF | 5792 | 200636_s_at | -0.3213 | 0.0721 | |
| GSE23400 | PTPRF | 5792 | 200636_s_at | 0.0380 | 0.6725 | |
| GSE26886 | PTPRF | 5792 | 200636_s_at | -0.2207 | 0.3791 | |
| GSE29001 | PTPRF | 5792 | 200636_s_at | -0.2020 | 0.6184 | |
| GSE38129 | PTPRF | 5792 | 200636_s_at | 0.0769 | 0.7212 | |
| GSE45670 | PTPRF | 5792 | 200636_s_at | 0.1721 | 0.3112 | |
| GSE53622 | PTPRF | 5792 | 69330 | -0.2306 | 0.0217 | |
| GSE53624 | PTPRF | 5792 | 69330 | -0.1262 | 0.1197 | |
| GSE63941 | PTPRF | 5792 | 200636_s_at | 2.1566 | 0.0002 | |
| GSE77861 | PTPRF | 5792 | 200636_s_at | -0.0355 | 0.9243 | |
| GSE97050 | PTPRF | 5792 | A_24_P385313 | -0.0079 | 0.9730 | |
| SRP007169 | PTPRF | 5792 | RNAseq | 0.9327 | 0.0541 | |
| SRP008496 | PTPRF | 5792 | RNAseq | 0.7626 | 0.0129 | |
| SRP064894 | PTPRF | 5792 | RNAseq | 0.2746 | 0.3405 | |
| SRP133303 | PTPRF | 5792 | RNAseq | 0.1534 | 0.4816 | |
| SRP159526 | PTPRF | 5792 | RNAseq | 0.3518 | 0.2098 | |
| SRP193095 | PTPRF | 5792 | RNAseq | 0.0894 | 0.5848 | |
| SRP219564 | PTPRF | 5792 | RNAseq | 0.2247 | 0.7004 | |
| TCGA | PTPRF | 5792 | RNAseq | 0.1020 | 0.0447 |
Upregulated datasets: 1; Downregulated datasets: 0.
Survival by PTPRF expression:
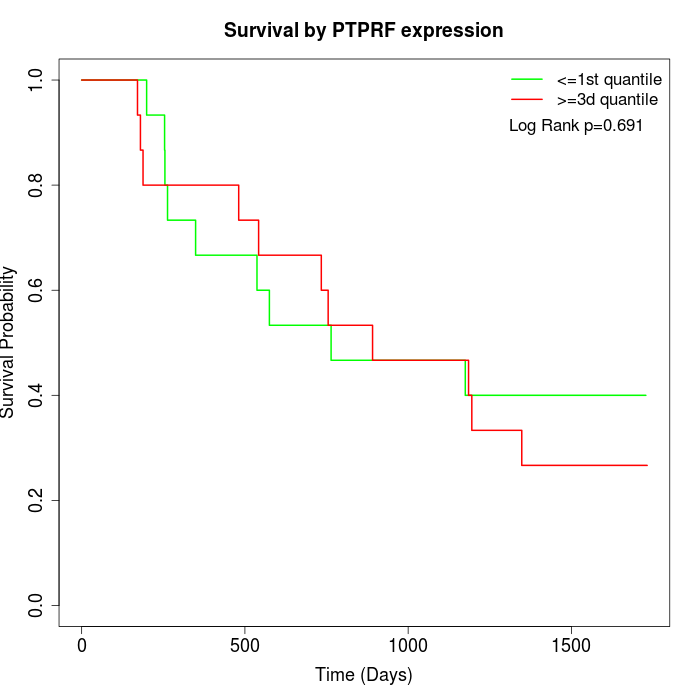 | 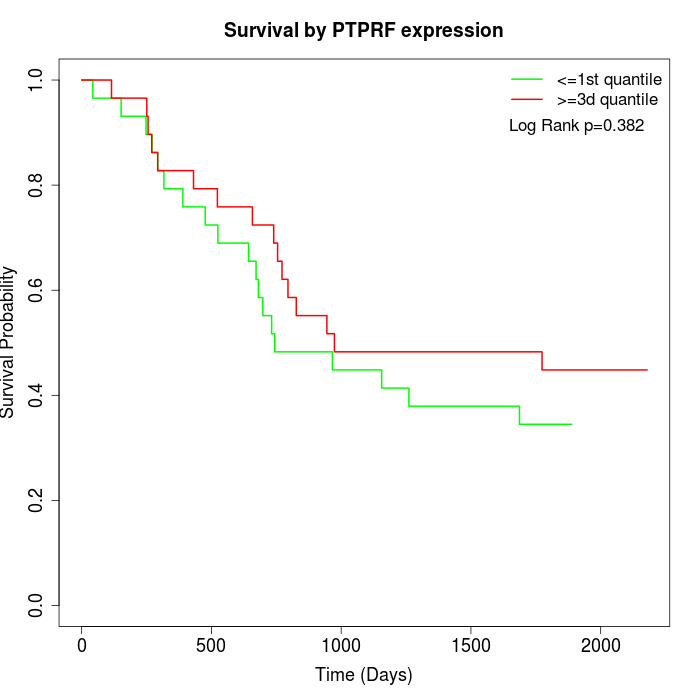 | 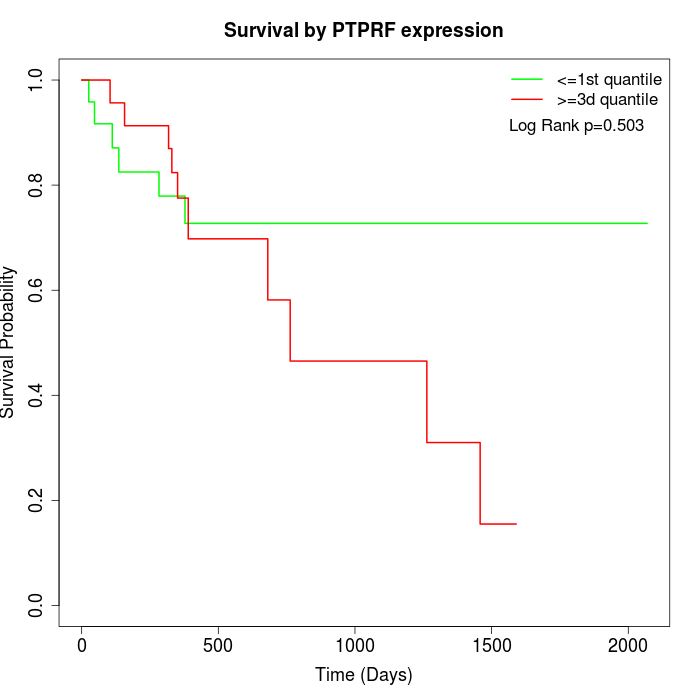 |
| GSE53622 | GSE53624 | TCGA |
Note: Click image to view full size file.
Copy number change of PTPRF:
| Dataset | Gene | EntrezID | Gain | Loss | Normal | Detail |
|---|---|---|---|---|---|---|
| GSE15526 | PTPRF | 5792 | 4 | 3 | 23 | |
| GSE20123 | PTPRF | 5792 | 4 | 2 | 24 | |
| GSE43470 | PTPRF | 5792 | 7 | 2 | 34 | |
| GSE46452 | PTPRF | 5792 | 3 | 1 | 55 | |
| GSE47630 | PTPRF | 5792 | 9 | 3 | 28 | |
| GSE54993 | PTPRF | 5792 | 0 | 2 | 68 | |
| GSE54994 | PTPRF | 5792 | 13 | 2 | 38 | |
| GSE60625 | PTPRF | 5792 | 0 | 0 | 11 | |
| GSE74703 | PTPRF | 5792 | 6 | 1 | 29 | |
| GSE74704 | PTPRF | 5792 | 2 | 0 | 18 | |
| TCGA | PTPRF | 5792 | 15 | 16 | 65 |
Total number of gains: 63; Total number of losses: 32; Total Number of normals: 393.
Somatic mutations of PTPRF:
Generating mutation plots.
Highly correlated genes for PTPRF:
Showing top 20/539 corelated genes with mean PCC>0.5.
| Gene1 | Gene2 | Mean PCC | Num. Datasets | Num. PCC<0 | Num. PCC>0.5 |
|---|---|---|---|---|---|
| PTPRF | ALDH5A1 | 0.757186 | 3 | 0 | 3 |
| PTPRF | SIDT1 | 0.756445 | 3 | 0 | 3 |
| PTPRF | GPR160 | 0.753865 | 3 | 0 | 3 |
| PTPRF | SRP9 | 0.74232 | 3 | 0 | 3 |
| PTPRF | XPNPEP1 | 0.731385 | 3 | 0 | 3 |
| PTPRF | RPA1 | 0.728384 | 3 | 0 | 3 |
| PTPRF | LRMP | 0.718003 | 3 | 0 | 3 |
| PTPRF | SAMD12 | 0.715979 | 3 | 0 | 3 |
| PTPRF | EHMT2 | 0.714074 | 3 | 0 | 3 |
| PTPRF | PAN2 | 0.712828 | 3 | 0 | 3 |
| PTPRF | TOPBP1 | 0.710297 | 3 | 0 | 3 |
| PTPRF | POLR2B | 0.704348 | 3 | 0 | 3 |
| PTPRF | MRPL37 | 0.700513 | 4 | 0 | 4 |
| PTPRF | PHF6 | 0.699269 | 3 | 0 | 3 |
| PTPRF | TIMELESS | 0.696758 | 3 | 0 | 3 |
| PTPRF | FBXL16 | 0.694355 | 3 | 0 | 3 |
| PTPRF | SMARCD2 | 0.693876 | 4 | 0 | 3 |
| PTPRF | SNRPE | 0.693588 | 3 | 0 | 3 |
| PTPRF | CDCA7 | 0.692682 | 3 | 0 | 3 |
| PTPRF | ERI3 | 0.691924 | 3 | 0 | 3 |
For details and further investigation, click here