| Full name: paired box 5 | Alias Symbol: BSAP | ||
| Type: protein-coding gene | Cytoband: 9p13.2 | ||
| Entrez ID: 5079 | HGNC ID: HGNC:8619 | Ensembl Gene: ENSG00000196092 | OMIM ID: 167414 |
Screen Evidence:
| |||
Expression of PAX5:
| Dataset | Gene | EntrezID | Probe | Log2FC | Adj.pValue | Expression |
|---|---|---|---|---|---|---|
| GSE17351 | PAX5 | 5079 | 221969_at | 0.5708 | 0.7055 | |
| GSE20347 | PAX5 | 5079 | 221969_at | 0.5063 | 0.0844 | |
| GSE23400 | PAX5 | 5079 | 206802_at | -0.2129 | 0.0000 | |
| GSE26886 | PAX5 | 5079 | 206802_at | 0.3736 | 0.0037 | |
| GSE29001 | PAX5 | 5079 | 221969_at | 1.7552 | 0.0054 | |
| GSE38129 | PAX5 | 5079 | 221969_at | 0.3292 | 0.3832 | |
| GSE45670 | PAX5 | 5079 | 221969_at | 0.5581 | 0.3022 | |
| GSE53622 | PAX5 | 5079 | 43078 | -1.0294 | 0.0006 | |
| GSE53624 | PAX5 | 5079 | 110423 | -0.2000 | 0.0547 | |
| GSE63941 | PAX5 | 5079 | 206802_at | 0.0618 | 0.7362 | |
| GSE77861 | PAX5 | 5079 | 206802_at | -0.0873 | 0.6251 | |
| GSE97050 | PAX5 | 5079 | A_23_P71624 | 0.5574 | 0.2151 | |
| SRP133303 | PAX5 | 5079 | RNAseq | -0.8573 | 0.1256 | |
| SRP159526 | PAX5 | 5079 | RNAseq | -2.0917 | 0.0662 | |
| SRP193095 | PAX5 | 5079 | RNAseq | 0.3548 | 0.3757 | |
| SRP219564 | PAX5 | 5079 | RNAseq | 2.1918 | 0.0039 | |
| TCGA | PAX5 | 5079 | RNAseq | 0.0813 | 0.8868 |
Upregulated datasets: 2; Downregulated datasets: 1.
Survival by PAX5 expression:
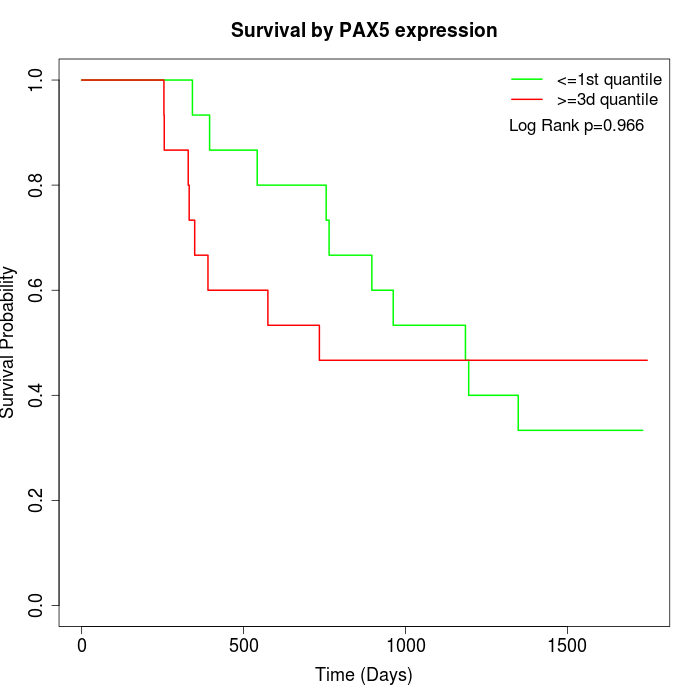 | 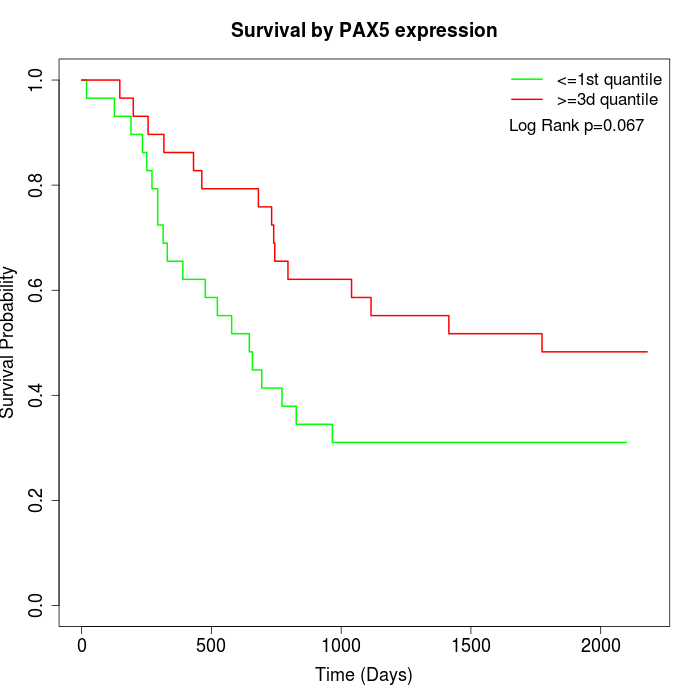 |  |
| GSE53622 | GSE53624 | TCGA |
Note: Click image to view full size file.
Copy number change of PAX5:
| Dataset | Gene | EntrezID | Gain | Loss | Normal | Detail |
|---|---|---|---|---|---|---|
| GSE15526 | PAX5 | 5079 | 3 | 12 | 15 | |
| GSE20123 | PAX5 | 5079 | 3 | 12 | 15 | |
| GSE43470 | PAX5 | 5079 | 1 | 12 | 30 | |
| GSE46452 | PAX5 | 5079 | 6 | 15 | 38 | |
| GSE47630 | PAX5 | 5079 | 1 | 20 | 19 | |
| GSE54993 | PAX5 | 5079 | 6 | 0 | 64 | |
| GSE54994 | PAX5 | 5079 | 5 | 13 | 35 | |
| GSE60625 | PAX5 | 5079 | 0 | 0 | 11 | |
| GSE74703 | PAX5 | 5079 | 1 | 8 | 27 | |
| GSE74704 | PAX5 | 5079 | 0 | 10 | 10 | |
| TCGA | PAX5 | 5079 | 14 | 44 | 38 |
Total number of gains: 40; Total number of losses: 146; Total Number of normals: 302.
Somatic mutations of PAX5:
Generating mutation plots.
Highly correlated genes for PAX5:
Showing top 20/288 corelated genes with mean PCC>0.5.
| Gene1 | Gene2 | Mean PCC | Num. Datasets | Num. PCC<0 | Num. PCC>0.5 |
|---|---|---|---|---|---|
| PAX5 | SIX1 | 0.780894 | 3 | 0 | 3 |
| PAX5 | ECE2 | 0.730054 | 3 | 0 | 3 |
| PAX5 | CPSF1 | 0.708577 | 4 | 0 | 4 |
| PAX5 | ZC3H12D | 0.70483 | 4 | 0 | 4 |
| PAX5 | ACTL6B | 0.701597 | 3 | 0 | 3 |
| PAX5 | ZNF771 | 0.701381 | 3 | 0 | 3 |
| PAX5 | ADM2 | 0.699517 | 3 | 0 | 3 |
| PAX5 | TP53TG5 | 0.697446 | 3 | 0 | 3 |
| PAX5 | GPR162 | 0.695556 | 3 | 0 | 3 |
| PAX5 | FUZ | 0.693098 | 3 | 0 | 3 |
| PAX5 | TBX1 | 0.687356 | 4 | 0 | 4 |
| PAX5 | CCDC134 | 0.684467 | 4 | 0 | 4 |
| PAX5 | CLEC17A | 0.683929 | 3 | 0 | 3 |
| PAX5 | FERMT3 | 0.683921 | 4 | 0 | 4 |
| PAX5 | KLK15 | 0.682936 | 3 | 0 | 3 |
| PAX5 | LPA | 0.679605 | 3 | 0 | 3 |
| PAX5 | FCRL5 | 0.676267 | 5 | 0 | 3 |
| PAX5 | FANCE | 0.675514 | 3 | 0 | 3 |
| PAX5 | CCDC151 | 0.674998 | 3 | 0 | 3 |
| PAX5 | HOXD11 | 0.667704 | 3 | 0 | 3 |
For details and further investigation, click here