| Full name: lipoprotein(a) | Alias Symbol: Lp(a) | ||
| Type: protein-coding gene | Cytoband: 6q25.3-q26 | ||
| Entrez ID: 4018 | HGNC ID: HGNC:6667 | Ensembl Gene: ENSG00000198670 | OMIM ID: 152200 |
Expression of LPA:
| Dataset | Gene | EntrezID | Probe | Log2FC | Adj.pValue | Expression |
|---|---|---|---|---|---|---|
| GSE17351 | LPA | 4018 | 207584_at | 0.0418 | 0.9176 | |
| GSE20347 | LPA | 4018 | 207584_at | -0.0451 | 0.4496 | |
| GSE23400 | LPA | 4018 | 207584_at | -0.0264 | 0.1533 | |
| GSE26886 | LPA | 4018 | 207584_at | 0.3091 | 0.0062 | |
| GSE29001 | LPA | 4018 | 207584_at | -0.1418 | 0.1951 | |
| GSE38129 | LPA | 4018 | 207584_at | -0.0520 | 0.3316 | |
| GSE45670 | LPA | 4018 | 207584_at | 0.1474 | 0.2489 | |
| GSE53622 | LPA | 4018 | 1891 | 0.2558 | 0.1083 | |
| GSE53624 | LPA | 4018 | 1891 | 0.3093 | 0.0178 | |
| GSE63941 | LPA | 4018 | 207584_at | 0.0534 | 0.7090 | |
| GSE77861 | LPA | 4018 | 207584_at | -0.0091 | 0.9235 | |
| GSE97050 | LPA | 4018 | A_23_P386888 | 0.3556 | 0.1726 | |
| SRP159526 | LPA | 4018 | RNAseq | -1.6692 | 0.0109 | |
| TCGA | LPA | 4018 | RNAseq | 3.8660 | 0.0000 |
Upregulated datasets: 1; Downregulated datasets: 1.
Survival by LPA expression:
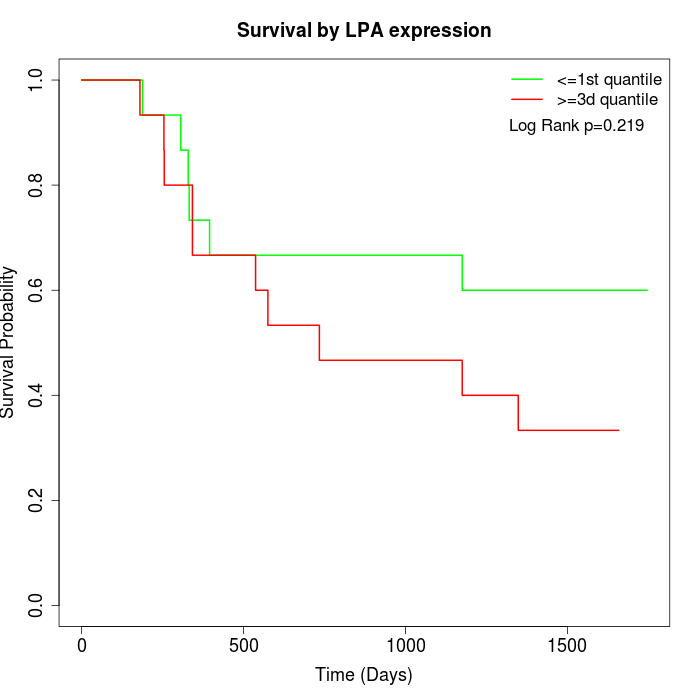 | 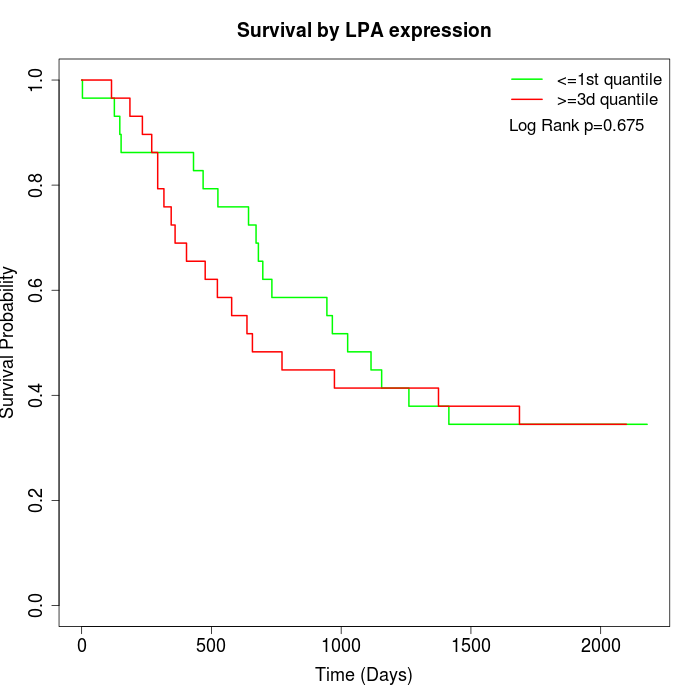 | 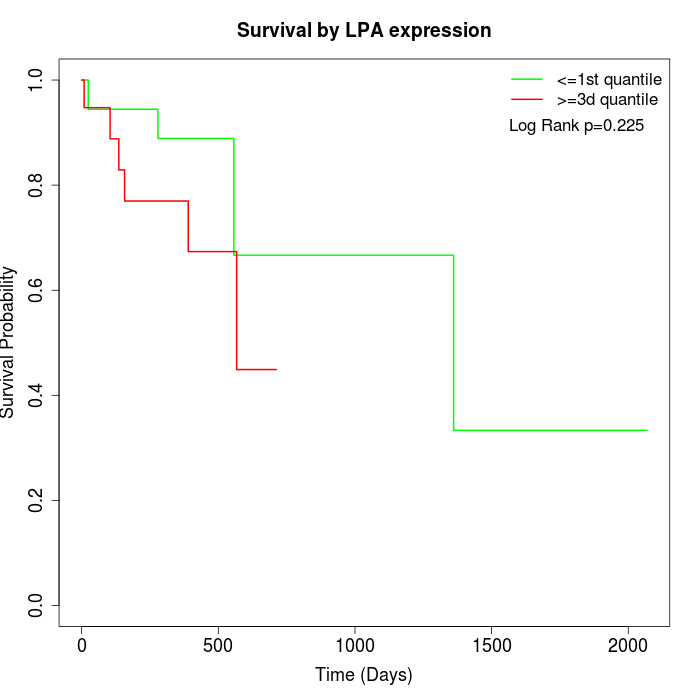 |
| GSE53622 | GSE53624 | TCGA |
Note: Click image to view full size file.
Copy number change of LPA:
| Dataset | Gene | EntrezID | Gain | Loss | Normal | Detail |
|---|---|---|---|---|---|---|
| GSE15526 | LPA | 4018 | 1 | 5 | 24 | |
| GSE20123 | LPA | 4018 | 1 | 4 | 25 | |
| GSE43470 | LPA | 4018 | 4 | 0 | 39 | |
| GSE46452 | LPA | 4018 | 3 | 10 | 46 | |
| GSE47630 | LPA | 4018 | 9 | 4 | 27 | |
| GSE54993 | LPA | 4018 | 4 | 4 | 62 | |
| GSE54994 | LPA | 4018 | 8 | 9 | 36 | |
| GSE60625 | LPA | 4018 | 0 | 1 | 10 | |
| GSE74703 | LPA | 4018 | 4 | 0 | 32 | |
| GSE74704 | LPA | 4018 | 0 | 2 | 18 | |
| TCGA | LPA | 4018 | 13 | 23 | 60 |
Total number of gains: 47; Total number of losses: 62; Total Number of normals: 379.
Somatic mutations of LPA:
Generating mutation plots.
Highly correlated genes for LPA:
Showing top 20/67 corelated genes with mean PCC>0.5.
| Gene1 | Gene2 | Mean PCC | Num. Datasets | Num. PCC<0 | Num. PCC>0.5 |
|---|---|---|---|---|---|
| LPA | PAX5 | 0.679605 | 3 | 0 | 3 |
| LPA | SLC39A4 | 0.674773 | 3 | 0 | 3 |
| LPA | SLFN5 | 0.666134 | 3 | 0 | 3 |
| LPA | RASEF | 0.646239 | 3 | 0 | 3 |
| LPA | PLEKHG4B | 0.633095 | 3 | 0 | 3 |
| LPA | LRFN1 | 0.629407 | 3 | 0 | 3 |
| LPA | TMEM74B | 0.628933 | 3 | 0 | 3 |
| LPA | PABPC1L | 0.614777 | 3 | 0 | 3 |
| LPA | CELA1 | 0.607168 | 3 | 0 | 3 |
| LPA | PTOV1 | 0.605003 | 3 | 0 | 3 |
| LPA | GTSE1 | 0.602526 | 3 | 0 | 3 |
| LPA | ZNF462 | 0.597268 | 3 | 0 | 3 |
| LPA | SEMA3B | 0.596826 | 4 | 0 | 4 |
| LPA | PRDM14 | 0.595649 | 4 | 0 | 3 |
| LPA | CRHR2 | 0.58979 | 4 | 0 | 4 |
| LPA | LRTM1 | 0.585962 | 4 | 0 | 3 |
| LPA | HOXD13 | 0.585011 | 3 | 0 | 3 |
| LPA | B4GALT7 | 0.584678 | 3 | 0 | 3 |
| LPA | LY9 | 0.583812 | 4 | 0 | 4 |
| LPA | A1BG | 0.582028 | 3 | 0 | 3 |
For details and further investigation, click here