| Full name: phosphodiesterase 9A | Alias Symbol: | ||
| Type: protein-coding gene | Cytoband: 21q22.3 | ||
| Entrez ID: 5152 | HGNC ID: HGNC:8795 | Ensembl Gene: ENSG00000160191 | OMIM ID: 602973 |
| Related drugs: DIPYRIDAMOLE, PENTOXIFYLLINE, ZAPRINAST... [more] | |||
Expression of PDE9A:
| Dataset | Gene | EntrezID | Probe | Log2FC | Adj.pValue | Expression |
|---|---|---|---|---|---|---|
| GSE17351 | PDE9A | 5152 | 205593_s_at | 0.1669 | 0.8638 | |
| GSE20347 | PDE9A | 5152 | 205593_s_at | 0.5437 | 0.0553 | |
| GSE23400 | PDE9A | 5152 | 205593_s_at | -0.2463 | 0.0002 | |
| GSE26886 | PDE9A | 5152 | 205593_s_at | 1.1459 | 0.0004 | |
| GSE29001 | PDE9A | 5152 | 205593_s_at | 0.3208 | 0.3626 | |
| GSE38129 | PDE9A | 5152 | 205593_s_at | 0.1686 | 0.6434 | |
| GSE45670 | PDE9A | 5152 | 205593_s_at | -0.4207 | 0.2518 | |
| GSE53622 | PDE9A | 5152 | 69417 | -1.5514 | 0.0000 | |
| GSE53624 | PDE9A | 5152 | 69417 | -0.8019 | 0.0000 | |
| GSE63941 | PDE9A | 5152 | 205593_s_at | -0.8664 | 0.2423 | |
| GSE77861 | PDE9A | 5152 | 205593_s_at | 0.3720 | 0.1927 | |
| GSE97050 | PDE9A | 5152 | A_33_P3419594 | -0.0142 | 0.9557 | |
| SRP064894 | PDE9A | 5152 | RNAseq | 0.7779 | 0.0774 | |
| SRP133303 | PDE9A | 5152 | RNAseq | 0.0427 | 0.8863 | |
| SRP159526 | PDE9A | 5152 | RNAseq | 1.0746 | 0.0214 | |
| SRP193095 | PDE9A | 5152 | RNAseq | 0.9184 | 0.0008 | |
| SRP219564 | PDE9A | 5152 | RNAseq | -0.2812 | 0.7758 | |
| TCGA | PDE9A | 5152 | RNAseq | -0.5478 | 0.0587 |
Upregulated datasets: 2; Downregulated datasets: 1.
Survival by PDE9A expression:
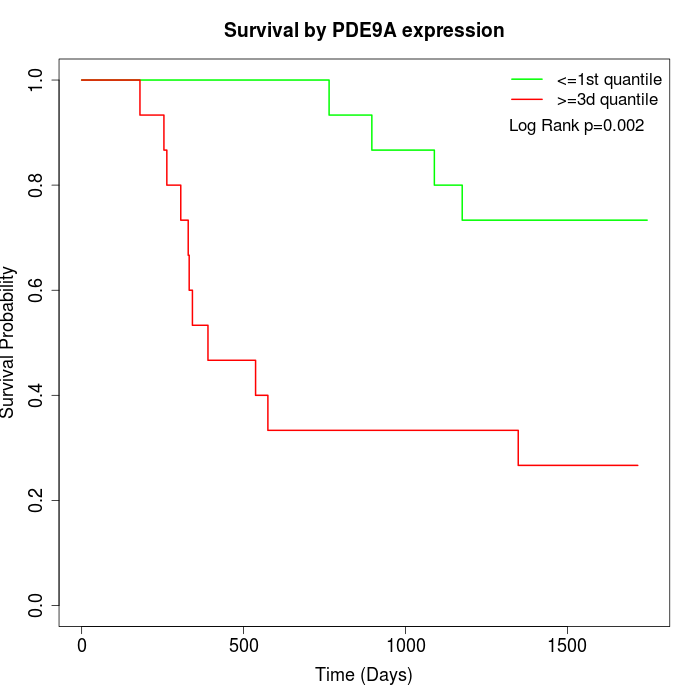 | 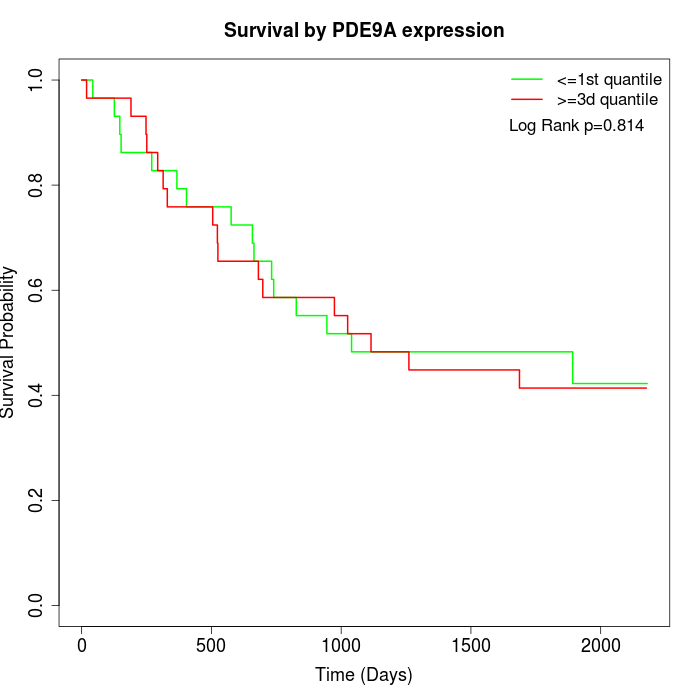 | 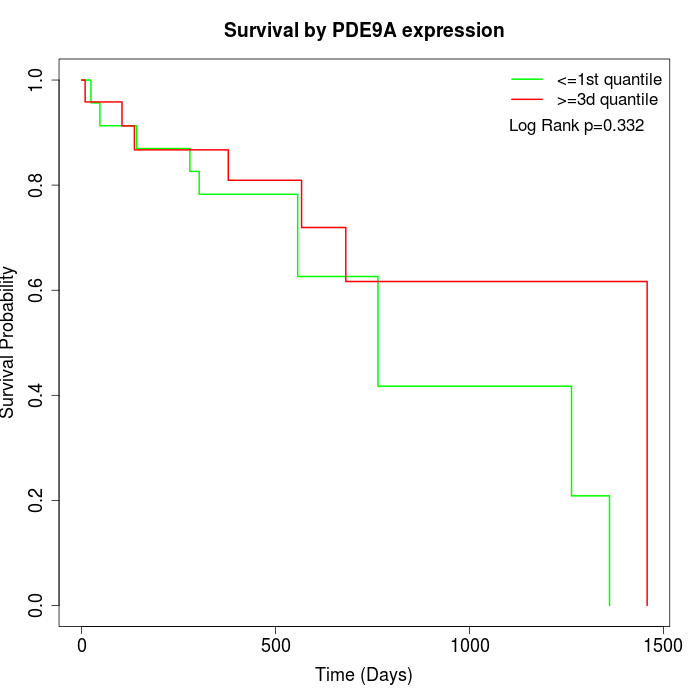 |
| GSE53622 | GSE53624 | TCGA |
Note: Click image to view full size file.
Copy number change of PDE9A:
| Dataset | Gene | EntrezID | Gain | Loss | Normal | Detail |
|---|---|---|---|---|---|---|
| GSE15526 | PDE9A | 5152 | 2 | 8 | 20 | |
| GSE20123 | PDE9A | 5152 | 2 | 8 | 20 | |
| GSE43470 | PDE9A | 5152 | 0 | 13 | 30 | |
| GSE46452 | PDE9A | 5152 | 1 | 21 | 37 | |
| GSE47630 | PDE9A | 5152 | 6 | 17 | 17 | |
| GSE54993 | PDE9A | 5152 | 8 | 1 | 61 | |
| GSE54994 | PDE9A | 5152 | 4 | 8 | 41 | |
| GSE60625 | PDE9A | 5152 | 0 | 0 | 11 | |
| GSE74703 | PDE9A | 5152 | 0 | 10 | 26 | |
| GSE74704 | PDE9A | 5152 | 1 | 4 | 15 | |
| TCGA | PDE9A | 5152 | 7 | 40 | 49 |
Total number of gains: 31; Total number of losses: 130; Total Number of normals: 327.
Somatic mutations of PDE9A:
Generating mutation plots.
Highly correlated genes for PDE9A:
Showing top 20/659 corelated genes with mean PCC>0.5.
| Gene1 | Gene2 | Mean PCC | Num. Datasets | Num. PCC<0 | Num. PCC>0.5 |
|---|---|---|---|---|---|
| PDE9A | PRKACA | 0.748802 | 3 | 0 | 3 |
| PDE9A | ASH2L | 0.744268 | 3 | 0 | 3 |
| PDE9A | TNRC6B | 0.70015 | 3 | 0 | 3 |
| PDE9A | CHIC1 | 0.699932 | 3 | 0 | 3 |
| PDE9A | NDUFAF4 | 0.693668 | 3 | 0 | 3 |
| PDE9A | WDR81 | 0.688983 | 3 | 0 | 3 |
| PDE9A | PTPDC1 | 0.688199 | 3 | 0 | 3 |
| PDE9A | DNAJC8 | 0.68741 | 3 | 0 | 3 |
| PDE9A | C20orf194 | 0.684862 | 3 | 0 | 3 |
| PDE9A | POLR2J | 0.678679 | 3 | 0 | 3 |
| PDE9A | PTP4A3 | 0.676715 | 6 | 0 | 5 |
| PDE9A | SDR39U1 | 0.675731 | 3 | 0 | 3 |
| PDE9A | CACNA1H | 0.674676 | 3 | 0 | 3 |
| PDE9A | CAMK1 | 0.671661 | 4 | 0 | 4 |
| PDE9A | CORO6 | 0.664779 | 3 | 0 | 3 |
| PDE9A | MAP1A | 0.660729 | 5 | 0 | 4 |
| PDE9A | MPPED2 | 0.657628 | 3 | 0 | 3 |
| PDE9A | HIBADH | 0.656243 | 3 | 0 | 3 |
| PDE9A | KIAA1324L | 0.650817 | 3 | 0 | 3 |
| PDE9A | GMPR | 0.648001 | 5 | 0 | 4 |
For details and further investigation, click here