| Full name: protein tyrosine phosphatase domain containing 1 | Alias Symbol: PTP9Q22|FLJ37312 | ||
| Type: protein-coding gene | Cytoband: 9q22.32 | ||
| Entrez ID: 138639 | HGNC ID: HGNC:30184 | Ensembl Gene: ENSG00000158079 | OMIM ID: |
Screen Evidence:
| |||
Expression of PTPDC1:
| Dataset | Gene | EntrezID | Probe | Log2FC | Adj.pValue | Expression |
|---|---|---|---|---|---|---|
| GSE17351 | PTPDC1 | 138639 | 229517_at | 0.1271 | 0.8657 | |
| GSE26886 | PTPDC1 | 138639 | 229517_at | 1.1181 | 0.0001 | |
| GSE45670 | PTPDC1 | 138639 | 229517_at | 0.4581 | 0.0329 | |
| GSE53622 | PTPDC1 | 138639 | 24591 | 0.5628 | 0.0000 | |
| GSE53624 | PTPDC1 | 138639 | 24591 | 1.0264 | 0.0000 | |
| GSE63941 | PTPDC1 | 138639 | 229517_at | 0.7604 | 0.1657 | |
| GSE77861 | PTPDC1 | 138639 | 229517_at | 0.2587 | 0.0690 | |
| GSE97050 | PTPDC1 | 138639 | A_23_P20876 | -0.0956 | 0.7578 | |
| SRP007169 | PTPDC1 | 138639 | RNAseq | 2.6966 | 0.0000 | |
| SRP008496 | PTPDC1 | 138639 | RNAseq | 2.0061 | 0.0000 | |
| SRP064894 | PTPDC1 | 138639 | RNAseq | 1.3450 | 0.0000 | |
| SRP133303 | PTPDC1 | 138639 | RNAseq | 1.0812 | 0.0000 | |
| SRP159526 | PTPDC1 | 138639 | RNAseq | 1.1751 | 0.0049 | |
| SRP193095 | PTPDC1 | 138639 | RNAseq | 0.7239 | 0.0000 | |
| SRP219564 | PTPDC1 | 138639 | RNAseq | 0.7498 | 0.0828 | |
| TCGA | PTPDC1 | 138639 | RNAseq | -0.1376 | 0.0970 |
Upregulated datasets: 7; Downregulated datasets: 0.
Survival by PTPDC1 expression:
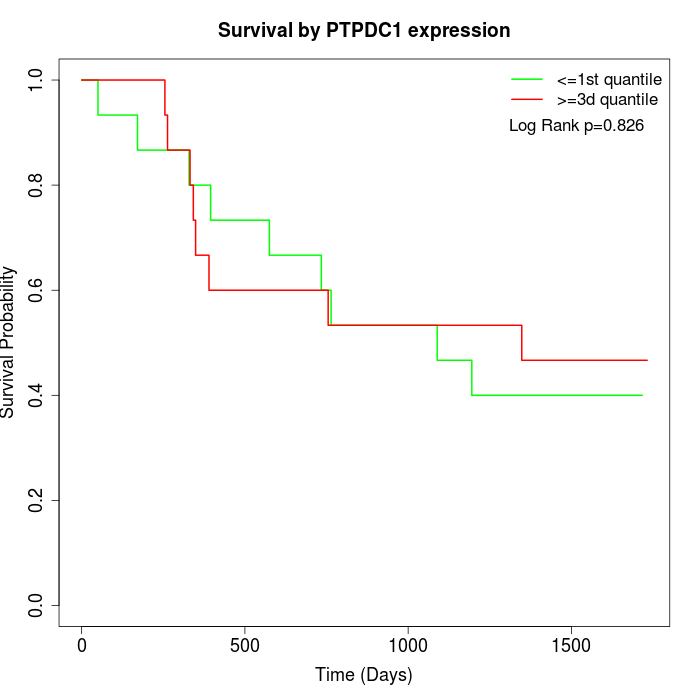 | 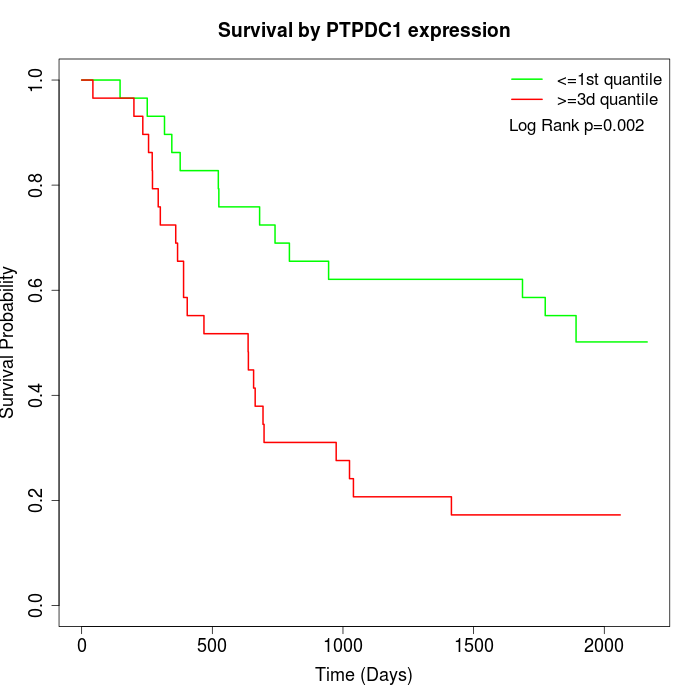 | 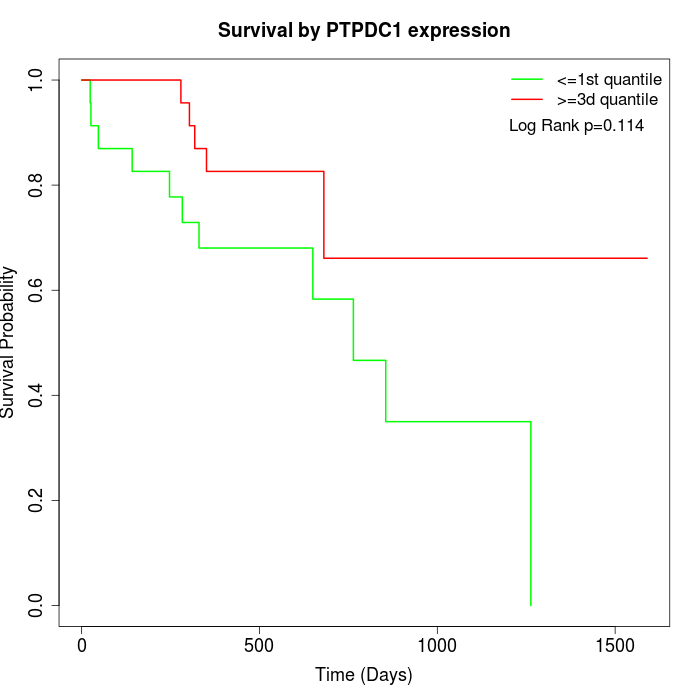 |
| GSE53622 | GSE53624 | TCGA |
Note: Click image to view full size file.
Copy number change of PTPDC1:
| Dataset | Gene | EntrezID | Gain | Loss | Normal | Detail |
|---|---|---|---|---|---|---|
| GSE15526 | PTPDC1 | 138639 | 5 | 9 | 16 | |
| GSE20123 | PTPDC1 | 138639 | 5 | 9 | 16 | |
| GSE43470 | PTPDC1 | 138639 | 6 | 3 | 34 | |
| GSE46452 | PTPDC1 | 138639 | 6 | 14 | 39 | |
| GSE47630 | PTPDC1 | 138639 | 1 | 17 | 22 | |
| GSE54993 | PTPDC1 | 138639 | 4 | 2 | 64 | |
| GSE54994 | PTPDC1 | 138639 | 8 | 11 | 34 | |
| GSE60625 | PTPDC1 | 138639 | 0 | 0 | 11 | |
| GSE74703 | PTPDC1 | 138639 | 5 | 3 | 28 | |
| GSE74704 | PTPDC1 | 138639 | 2 | 7 | 11 | |
| TCGA | PTPDC1 | 138639 | 24 | 23 | 49 |
Total number of gains: 66; Total number of losses: 98; Total Number of normals: 324.
Somatic mutations of PTPDC1:
Generating mutation plots.
Highly correlated genes for PTPDC1:
Showing top 20/751 corelated genes with mean PCC>0.5.
| Gene1 | Gene2 | Mean PCC | Num. Datasets | Num. PCC<0 | Num. PCC>0.5 |
|---|---|---|---|---|---|
| PTPDC1 | ARMC9 | 0.722589 | 3 | 0 | 3 |
| PTPDC1 | TRAF5 | 0.698467 | 4 | 0 | 4 |
| PTPDC1 | ITIH6 | 0.689369 | 3 | 0 | 3 |
| PTPDC1 | PDE9A | 0.688199 | 3 | 0 | 3 |
| PTPDC1 | CEP112 | 0.688054 | 3 | 0 | 3 |
| PTPDC1 | FCGR2A | 0.687201 | 3 | 0 | 3 |
| PTPDC1 | MICAL2 | 0.685397 | 3 | 0 | 3 |
| PTPDC1 | MXRA7 | 0.685207 | 4 | 0 | 4 |
| PTPDC1 | EME1 | 0.684375 | 3 | 0 | 3 |
| PTPDC1 | TUBE1 | 0.680593 | 3 | 0 | 3 |
| PTPDC1 | RASD2 | 0.678492 | 4 | 0 | 3 |
| PTPDC1 | ITPK1 | 0.672431 | 4 | 0 | 3 |
| PTPDC1 | INPP4A | 0.671964 | 6 | 0 | 6 |
| PTPDC1 | DNAJC18 | 0.667363 | 3 | 0 | 3 |
| PTPDC1 | HS1BP3 | 0.667231 | 5 | 0 | 4 |
| PTPDC1 | DPY19L2 | 0.666808 | 3 | 0 | 3 |
| PTPDC1 | EIF5A2 | 0.663712 | 7 | 0 | 6 |
| PTPDC1 | MIPOL1 | 0.663622 | 3 | 0 | 3 |
| PTPDC1 | HABP4 | 0.659284 | 4 | 0 | 3 |
| PTPDC1 | SDR39U1 | 0.654646 | 3 | 0 | 3 |
For details and further investigation, click here