| Full name: platelet factor 4 | Alias Symbol: SCYB4|CXCL4 | ||
| Type: protein-coding gene | Cytoband: 4q13.3 | ||
| Entrez ID: 5196 | HGNC ID: HGNC:8861 | Ensembl Gene: ENSG00000163737 | OMIM ID: 173460 |
PF4 involved pathways:
| KEGG pathway | Description | View |
|---|---|---|
| hsa04062 | Chemokine signaling pathway |
Expression of PF4:
| Dataset | Gene | EntrezID | Probe | Log2FC | Adj.pValue | Expression |
|---|---|---|---|---|---|---|
| GSE17351 | PF4 | 5196 | 206390_x_at | -0.0937 | 0.6567 | |
| GSE20347 | PF4 | 5196 | 206390_x_at | -0.1749 | 0.0193 | |
| GSE23400 | PF4 | 5196 | 206390_x_at | -0.2563 | 0.0000 | |
| GSE26886 | PF4 | 5196 | 206390_x_at | -0.3065 | 0.0918 | |
| GSE29001 | PF4 | 5196 | 206390_x_at | -0.2128 | 0.2324 | |
| GSE38129 | PF4 | 5196 | 206390_x_at | -0.3700 | 0.0193 | |
| GSE45670 | PF4 | 5196 | 206390_x_at | 0.1793 | 0.4303 | |
| GSE53622 | PF4 | 5196 | 15422 | 0.1679 | 0.1566 | |
| GSE53624 | PF4 | 5196 | 15422 | 0.2592 | 0.0040 | |
| GSE63941 | PF4 | 5196 | 206390_x_at | -1.2832 | 0.0032 | |
| GSE77861 | PF4 | 5196 | 206390_x_at | -0.1411 | 0.2303 | |
| GSE97050 | PF4 | 5196 | A_24_P79403 | -0.2285 | 0.5835 | |
| TCGA | PF4 | 5196 | RNAseq | -1.5565 | 0.2517 |
Upregulated datasets: 0; Downregulated datasets: 1.
Survival by PF4 expression:
 | 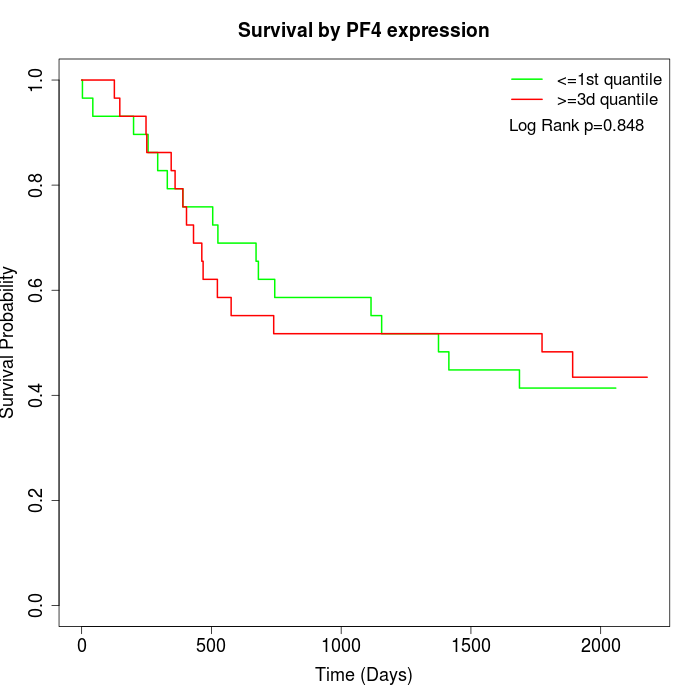 |  |
| GSE53622 | GSE53624 | TCGA |
Note: Click image to view full size file.
Copy number change of PF4:
| Dataset | Gene | EntrezID | Gain | Loss | Normal | Detail |
|---|---|---|---|---|---|---|
| GSE15526 | PF4 | 5196 | 2 | 9 | 19 | |
| GSE20123 | PF4 | 5196 | 2 | 9 | 19 | |
| GSE43470 | PF4 | 5196 | 0 | 13 | 30 | |
| GSE46452 | PF4 | 5196 | 3 | 34 | 22 | |
| GSE47630 | PF4 | 5196 | 1 | 19 | 20 | |
| GSE54993 | PF4 | 5196 | 7 | 0 | 63 | |
| GSE54994 | PF4 | 5196 | 1 | 9 | 43 | |
| GSE60625 | PF4 | 5196 | 0 | 0 | 11 | |
| GSE74703 | PF4 | 5196 | 0 | 11 | 25 | |
| GSE74704 | PF4 | 5196 | 2 | 5 | 13 | |
| TCGA | PF4 | 5196 | 19 | 28 | 49 |
Total number of gains: 37; Total number of losses: 137; Total Number of normals: 314.
Somatic mutations of PF4:
Generating mutation plots.
Highly correlated genes for PF4:
Showing top 20/687 corelated genes with mean PCC>0.5.
| Gene1 | Gene2 | Mean PCC | Num. Datasets | Num. PCC<0 | Num. PCC>0.5 |
|---|---|---|---|---|---|
| PF4 | DRP2 | 0.738399 | 4 | 0 | 3 |
| PF4 | DAGLA | 0.733415 | 3 | 0 | 3 |
| PF4 | UMOD | 0.726003 | 5 | 0 | 5 |
| PF4 | HNF1A | 0.724651 | 4 | 0 | 4 |
| PF4 | SPX | 0.723599 | 3 | 0 | 3 |
| PF4 | BFSP2 | 0.722966 | 4 | 0 | 4 |
| PF4 | SYN1 | 0.721269 | 4 | 0 | 4 |
| PF4 | NPTXR | 0.709995 | 5 | 0 | 5 |
| PF4 | CACNG5 | 0.706691 | 3 | 0 | 3 |
| PF4 | IL9R | 0.706502 | 5 | 0 | 5 |
| PF4 | PAX3 | 0.703695 | 5 | 0 | 5 |
| PF4 | HAO2 | 0.703424 | 3 | 0 | 3 |
| PF4 | AMHR2 | 0.697825 | 4 | 0 | 4 |
| PF4 | CNR2 | 0.696234 | 6 | 0 | 6 |
| PF4 | LZTS1 | 0.692311 | 3 | 0 | 3 |
| PF4 | SLC6A13 | 0.690502 | 3 | 0 | 3 |
| PF4 | SLC6A5 | 0.689475 | 3 | 0 | 3 |
| PF4 | TAL1 | 0.687804 | 4 | 0 | 4 |
| PF4 | LIPC | 0.686027 | 6 | 0 | 5 |
| PF4 | CLPS | 0.685279 | 4 | 0 | 3 |
For details and further investigation, click here