| Full name: protein inhibitor of activated STAT 3 | Alias Symbol: FLJ14651|ZMIZ5 | ||
| Type: protein-coding gene | Cytoband: 1q21.1 | ||
| Entrez ID: 10401 | HGNC ID: HGNC:16861 | Ensembl Gene: ENSG00000131788 | OMIM ID: 605987 |
PIAS3 involved pathways:
| KEGG pathway | Description | View |
|---|---|---|
| hsa04630 | Jak-STAT signaling pathway |
Expression of PIAS3:
| Dataset | Gene | EntrezID | Probe | Log2FC | Adj.pValue | Expression |
|---|---|---|---|---|---|---|
| GSE17351 | PIAS3 | 10401 | 203035_s_at | 0.2469 | 0.5670 | |
| GSE20347 | PIAS3 | 10401 | 203035_s_at | -0.0511 | 0.8537 | |
| GSE23400 | PIAS3 | 10401 | 203035_s_at | 0.0397 | 0.7006 | |
| GSE26886 | PIAS3 | 10401 | 203035_s_at | -0.5018 | 0.0145 | |
| GSE29001 | PIAS3 | 10401 | 203035_s_at | 0.1190 | 0.7445 | |
| GSE38129 | PIAS3 | 10401 | 203035_s_at | 0.2496 | 0.2239 | |
| GSE45670 | PIAS3 | 10401 | 203035_s_at | 0.1121 | 0.5249 | |
| GSE53622 | PIAS3 | 10401 | 45277 | 0.1463 | 0.0964 | |
| GSE53624 | PIAS3 | 10401 | 45277 | 0.0801 | 0.2161 | |
| GSE63941 | PIAS3 | 10401 | 203035_s_at | -0.3507 | 0.5178 | |
| GSE77861 | PIAS3 | 10401 | 203035_s_at | 0.2504 | 0.5891 | |
| GSE97050 | PIAS3 | 10401 | A_23_P149678 | 0.3902 | 0.2151 | |
| SRP007169 | PIAS3 | 10401 | RNAseq | 0.1527 | 0.7370 | |
| SRP008496 | PIAS3 | 10401 | RNAseq | 0.6111 | 0.0352 | |
| SRP064894 | PIAS3 | 10401 | RNAseq | -0.1029 | 0.6611 | |
| SRP133303 | PIAS3 | 10401 | RNAseq | -0.0261 | 0.9051 | |
| SRP159526 | PIAS3 | 10401 | RNAseq | -0.0917 | 0.6892 | |
| SRP193095 | PIAS3 | 10401 | RNAseq | -0.1307 | 0.3628 | |
| SRP219564 | PIAS3 | 10401 | RNAseq | 0.1595 | 0.7463 | |
| TCGA | PIAS3 | 10401 | RNAseq | 0.1291 | 0.0263 |
Upregulated datasets: 0; Downregulated datasets: 0.
Survival by PIAS3 expression:
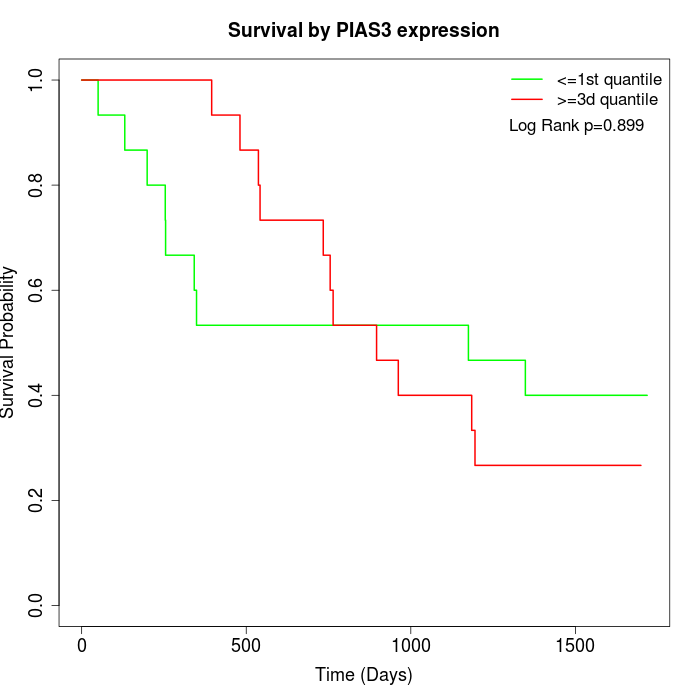 | 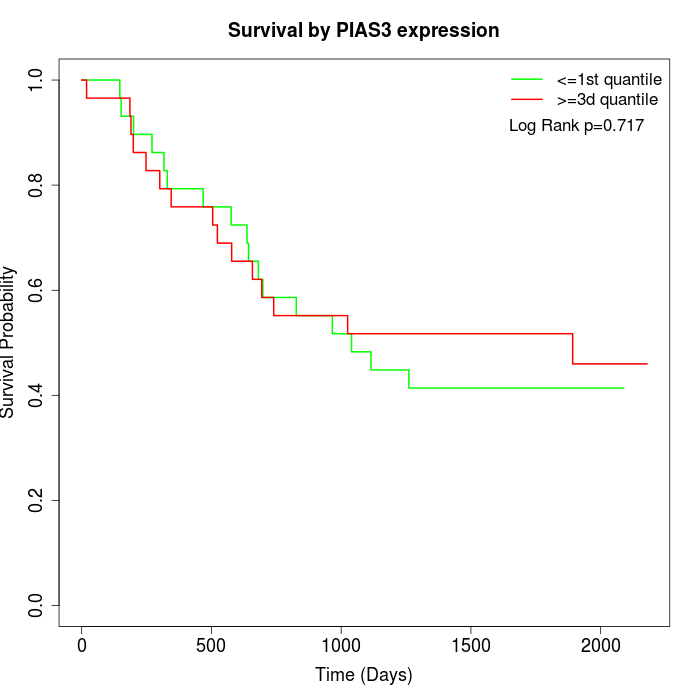 | 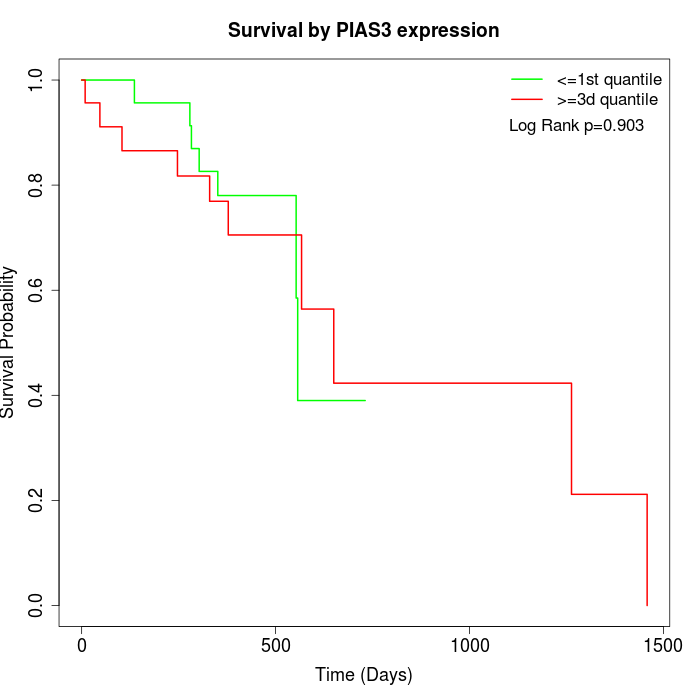 |
| GSE53622 | GSE53624 | TCGA |
Note: Click image to view full size file.
Copy number change of PIAS3:
| Dataset | Gene | EntrezID | Gain | Loss | Normal | Detail |
|---|---|---|---|---|---|---|
| GSE15526 | PIAS3 | 10401 | 12 | 0 | 18 | |
| GSE20123 | PIAS3 | 10401 | 12 | 0 | 18 | |
| GSE43470 | PIAS3 | 10401 | 5 | 1 | 37 | |
| GSE46452 | PIAS3 | 10401 | 2 | 1 | 56 | |
| GSE47630 | PIAS3 | 10401 | 12 | 2 | 26 | |
| GSE54993 | PIAS3 | 10401 | 0 | 2 | 68 | |
| GSE54994 | PIAS3 | 10401 | 15 | 0 | 38 | |
| GSE60625 | PIAS3 | 10401 | 0 | 0 | 11 | |
| GSE74703 | PIAS3 | 10401 | 5 | 1 | 30 | |
| GSE74704 | PIAS3 | 10401 | 6 | 0 | 14 | |
| TCGA | PIAS3 | 10401 | 33 | 15 | 48 |
Total number of gains: 102; Total number of losses: 22; Total Number of normals: 364.
Somatic mutations of PIAS3:
Generating mutation plots.
Highly correlated genes for PIAS3:
Showing top 20/234 corelated genes with mean PCC>0.5.
| Gene1 | Gene2 | Mean PCC | Num. Datasets | Num. PCC<0 | Num. PCC>0.5 |
|---|---|---|---|---|---|
| PIAS3 | AKT2 | 0.837921 | 3 | 0 | 3 |
| PIAS3 | CHD7 | 0.791096 | 3 | 0 | 3 |
| PIAS3 | RFX1 | 0.759907 | 3 | 0 | 3 |
| PIAS3 | MED12 | 0.758555 | 4 | 0 | 4 |
| PIAS3 | SLC25A14 | 0.756748 | 3 | 0 | 3 |
| PIAS3 | PSMC4 | 0.748284 | 3 | 0 | 3 |
| PIAS3 | RBM4B | 0.74699 | 4 | 0 | 3 |
| PIAS3 | NVL | 0.742867 | 3 | 0 | 3 |
| PIAS3 | PHF23 | 0.742202 | 4 | 0 | 3 |
| PIAS3 | NUDT19 | 0.73833 | 4 | 0 | 4 |
| PIAS3 | NBPF1 | 0.727403 | 3 | 0 | 3 |
| PIAS3 | TBC1D22B | 0.723574 | 3 | 0 | 3 |
| PIAS3 | PTPN23 | 0.718701 | 3 | 0 | 3 |
| PIAS3 | CDK5RAP3 | 0.7185 | 3 | 0 | 3 |
| PIAS3 | PIN4 | 0.716088 | 3 | 0 | 3 |
| PIAS3 | CLCN7 | 0.711626 | 3 | 0 | 3 |
| PIAS3 | TBRG1 | 0.708069 | 3 | 0 | 3 |
| PIAS3 | PPP2R1B | 0.705782 | 3 | 0 | 3 |
| PIAS3 | NAA25 | 0.701614 | 3 | 0 | 3 |
| PIAS3 | NCOA2 | 0.698979 | 3 | 0 | 3 |
For details and further investigation, click here