| Full name: phosphatidylinositol glycan anchor biosynthesis class N | Alias Symbol: MCD4|PIG-N | ||
| Type: protein-coding gene | Cytoband: 18q21.33 | ||
| Entrez ID: 23556 | HGNC ID: HGNC:8967 | Ensembl Gene: ENSG00000197563 | OMIM ID: 606097 |
Expression of PIGN:
| Dataset | Gene | EntrezID | Probe | Log2FC | Adj.pValue | Expression |
|---|---|---|---|---|---|---|
| GSE17351 | PIGN | 23556 | 219048_at | 0.0365 | 0.9747 | |
| GSE20347 | PIGN | 23556 | 219048_at | -1.4995 | 0.0000 | |
| GSE23400 | PIGN | 23556 | 219048_at | -0.6167 | 0.0000 | |
| GSE26886 | PIGN | 23556 | 219048_at | -2.3276 | 0.0000 | |
| GSE29001 | PIGN | 23556 | 219048_at | -1.3880 | 0.0002 | |
| GSE38129 | PIGN | 23556 | 219048_at | -0.9625 | 0.0001 | |
| GSE45670 | PIGN | 23556 | 232101_s_at | -0.4499 | 0.0720 | |
| GSE53622 | PIGN | 23556 | 87489 | -0.9709 | 0.0000 | |
| GSE53624 | PIGN | 23556 | 87489 | -1.3208 | 0.0000 | |
| GSE63941 | PIGN | 23556 | 232101_s_at | -1.3626 | 0.0368 | |
| GSE77861 | PIGN | 23556 | 232101_s_at | -1.1826 | 0.0436 | |
| GSE97050 | PIGN | 23556 | A_24_P193943 | -0.2712 | 0.2816 | |
| SRP007169 | PIGN | 23556 | RNAseq | -2.4842 | 0.0000 | |
| SRP008496 | PIGN | 23556 | RNAseq | -2.2385 | 0.0000 | |
| SRP064894 | PIGN | 23556 | RNAseq | -1.2582 | 0.0000 | |
| SRP133303 | PIGN | 23556 | RNAseq | -0.9511 | 0.0000 | |
| SRP159526 | PIGN | 23556 | RNAseq | -0.7401 | 0.1086 | |
| SRP193095 | PIGN | 23556 | RNAseq | -1.2865 | 0.0000 | |
| SRP219564 | PIGN | 23556 | RNAseq | -1.3475 | 0.0149 | |
| TCGA | PIGN | 23556 | RNAseq | -0.2479 | 0.0003 |
Upregulated datasets: 0; Downregulated datasets: 11.
Survival by PIGN expression:
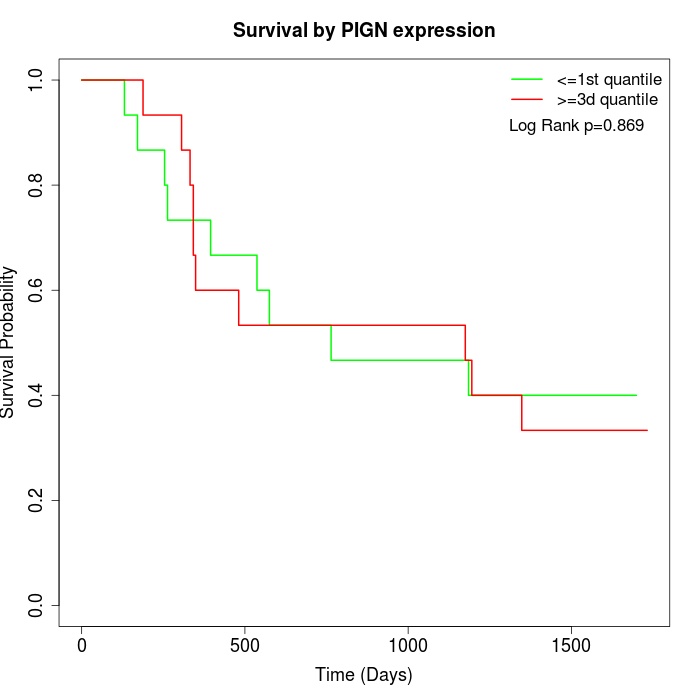 | 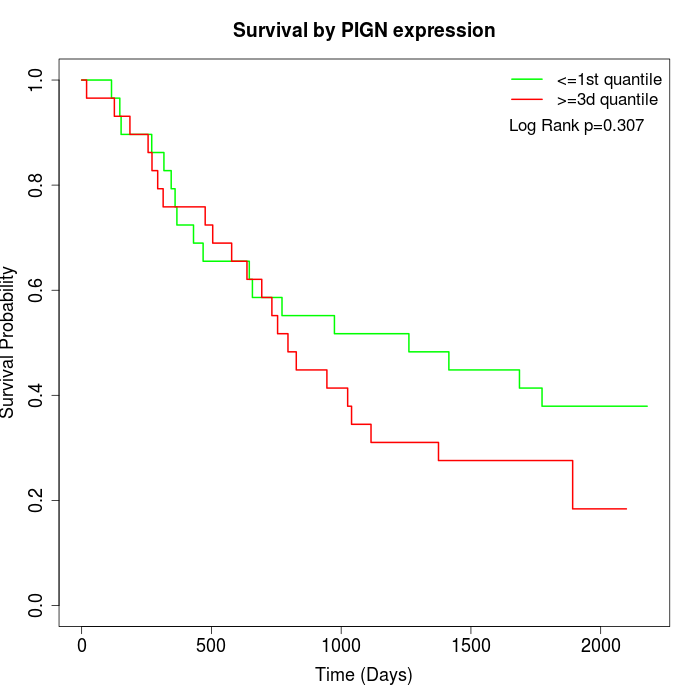 | 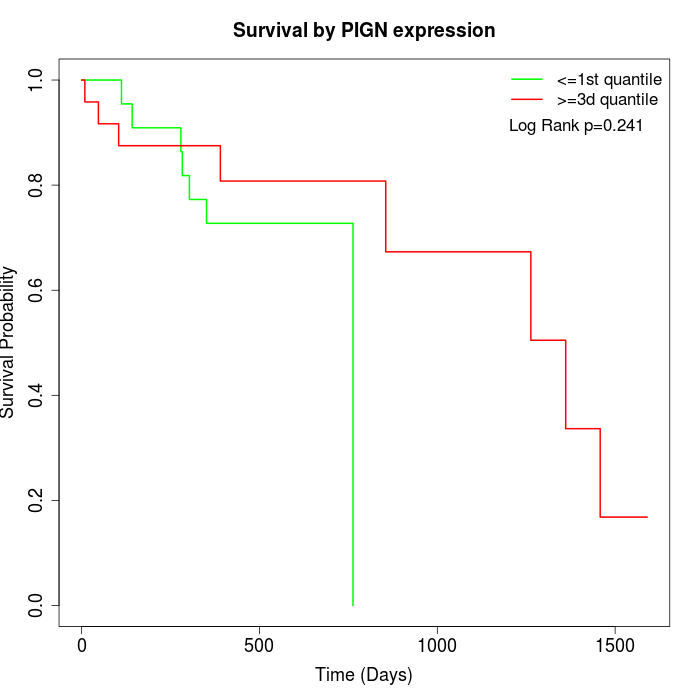 |
| GSE53622 | GSE53624 | TCGA |
Note: Click image to view full size file.
Copy number change of PIGN:
| Dataset | Gene | EntrezID | Gain | Loss | Normal | Detail |
|---|---|---|---|---|---|---|
| GSE15526 | PIGN | 23556 | 1 | 9 | 20 | |
| GSE20123 | PIGN | 23556 | 1 | 9 | 20 | |
| GSE43470 | PIGN | 23556 | 0 | 5 | 38 | |
| GSE46452 | PIGN | 23556 | 1 | 26 | 32 | |
| GSE47630 | PIGN | 23556 | 5 | 21 | 14 | |
| GSE54993 | PIGN | 23556 | 9 | 0 | 61 | |
| GSE54994 | PIGN | 23556 | 1 | 18 | 34 | |
| GSE60625 | PIGN | 23556 | 0 | 4 | 7 | |
| GSE74703 | PIGN | 23556 | 0 | 5 | 31 | |
| GSE74704 | PIGN | 23556 | 1 | 6 | 13 | |
| TCGA | PIGN | 23556 | 10 | 45 | 41 |
Total number of gains: 29; Total number of losses: 148; Total Number of normals: 311.
Somatic mutations of PIGN:
Generating mutation plots.
Highly correlated genes for PIGN:
Showing top 20/1407 corelated genes with mean PCC>0.5.
| Gene1 | Gene2 | Mean PCC | Num. Datasets | Num. PCC<0 | Num. PCC>0.5 |
|---|---|---|---|---|---|
| PIGN | SRRM1 | 0.80304 | 3 | 0 | 3 |
| PIGN | TAB3 | 0.795143 | 7 | 0 | 7 |
| PIGN | GOLGA4 | 0.779346 | 7 | 0 | 7 |
| PIGN | FCHO2 | 0.77875 | 6 | 0 | 6 |
| PIGN | SNORA68 | 0.775995 | 3 | 0 | 3 |
| PIGN | FAM214A | 0.770652 | 5 | 0 | 5 |
| PIGN | CPVL | 0.769445 | 3 | 0 | 3 |
| PIGN | CAPZA2 | 0.767795 | 3 | 0 | 3 |
| PIGN | THRAP3 | 0.7673 | 3 | 0 | 3 |
| PIGN | RBM20 | 0.764925 | 4 | 0 | 4 |
| PIGN | UBL3 | 0.763235 | 9 | 0 | 9 |
| PIGN | SLC16A6 | 0.757338 | 10 | 0 | 10 |
| PIGN | DLG2 | 0.75439 | 9 | 0 | 9 |
| PIGN | ZNF416 | 0.753991 | 5 | 0 | 5 |
| PIGN | MUC15 | 0.752602 | 5 | 0 | 5 |
| PIGN | KAT2B | 0.751609 | 10 | 0 | 10 |
| PIGN | CLIC3 | 0.749292 | 8 | 0 | 8 |
| PIGN | MRPS7 | 0.749285 | 3 | 0 | 3 |
| PIGN | FBXO3 | 0.748248 | 9 | 0 | 9 |
| PIGN | CA13 | 0.747919 | 3 | 0 | 3 |
For details and further investigation, click here