| Full name: serine and arginine repetitive matrix 1 | Alias Symbol: SRM160|POP101|MGC39488 | ||
| Type: protein-coding gene | Cytoband: 1p36.11 | ||
| Entrez ID: 10250 | HGNC ID: HGNC:16638 | Ensembl Gene: ENSG00000133226 | OMIM ID: 605975 |
Screen Evidence:
| |||
Expression of SRRM1:
| Dataset | Gene | EntrezID | Probe | Log2FC | Adj.pValue | Expression |
|---|---|---|---|---|---|---|
| GSE17351 | SRRM1 | 10250 | 201225_s_at | 0.1210 | 0.8100 | |
| GSE20347 | SRRM1 | 10250 | 201225_s_at | 0.0396 | 0.7661 | |
| GSE23400 | SRRM1 | 10250 | 201225_s_at | 0.1590 | 0.0023 | |
| GSE26886 | SRRM1 | 10250 | 201225_s_at | -1.2409 | 0.0000 | |
| GSE29001 | SRRM1 | 10250 | 201225_s_at | -0.0289 | 0.9100 | |
| GSE38129 | SRRM1 | 10250 | 201225_s_at | 0.0294 | 0.7618 | |
| GSE45670 | SRRM1 | 10250 | 201225_s_at | -0.2136 | 0.0197 | |
| GSE53622 | SRRM1 | 10250 | 2961 | -0.1253 | 0.0024 | |
| GSE53624 | SRRM1 | 10250 | 2961 | -0.0203 | 0.5795 | |
| GSE63941 | SRRM1 | 10250 | 201225_s_at | -0.1040 | 0.7755 | |
| GSE77861 | SRRM1 | 10250 | 201225_s_at | -0.2223 | 0.3639 | |
| GSE97050 | SRRM1 | 10250 | A_24_P11131 | -0.2233 | 0.2740 | |
| SRP007169 | SRRM1 | 10250 | RNAseq | 0.9741 | 0.0608 | |
| SRP008496 | SRRM1 | 10250 | RNAseq | 0.8056 | 0.0151 | |
| SRP064894 | SRRM1 | 10250 | RNAseq | 0.0473 | 0.7831 | |
| SRP133303 | SRRM1 | 10250 | RNAseq | -0.0155 | 0.8853 | |
| SRP159526 | SRRM1 | 10250 | RNAseq | 0.2372 | 0.5662 | |
| SRP193095 | SRRM1 | 10250 | RNAseq | -0.0287 | 0.7834 | |
| SRP219564 | SRRM1 | 10250 | RNAseq | -0.1170 | 0.5338 | |
| TCGA | SRRM1 | 10250 | RNAseq | -0.0071 | 0.8621 |
Upregulated datasets: 0; Downregulated datasets: 1.
Survival by SRRM1 expression:
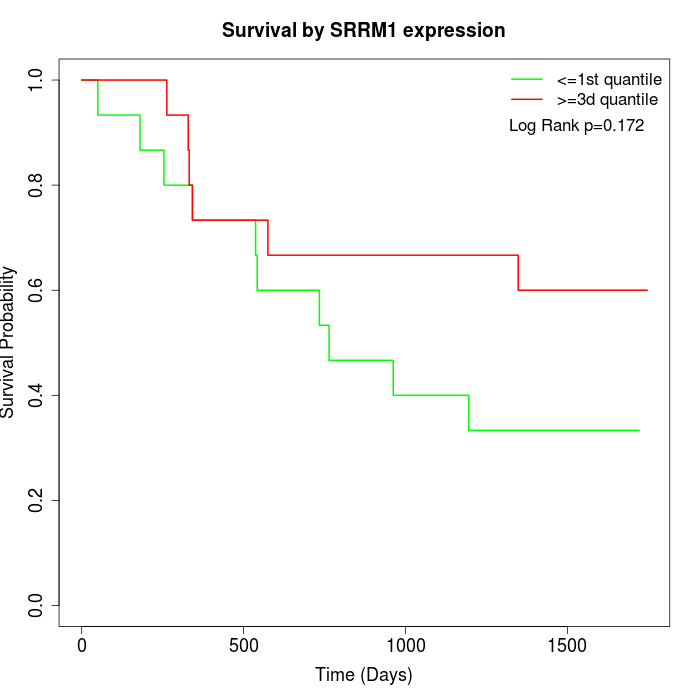 | 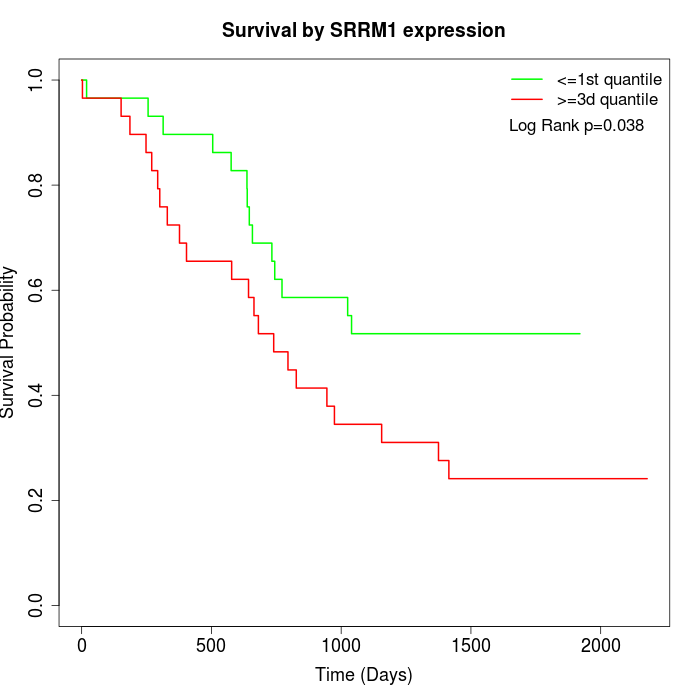 | 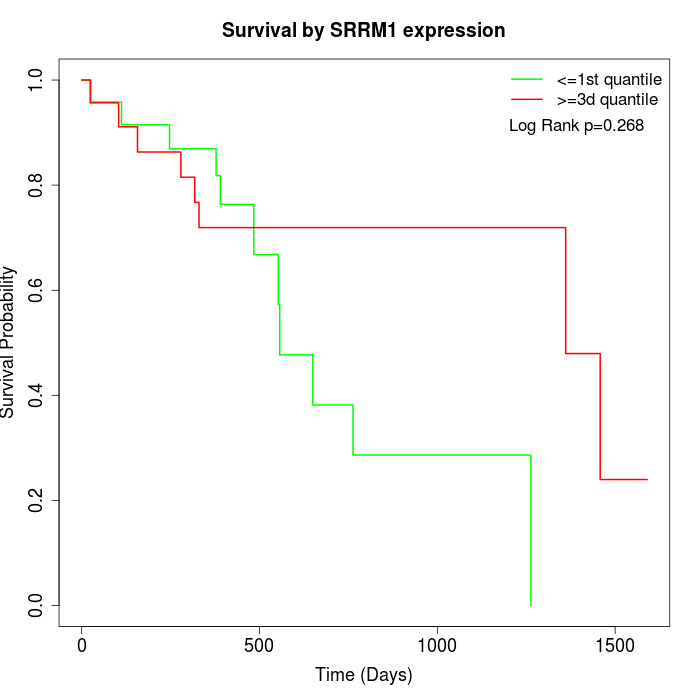 |
| GSE53622 | GSE53624 | TCGA |
Note: Click image to view full size file.
Copy number change of SRRM1:
| Dataset | Gene | EntrezID | Gain | Loss | Normal | Detail |
|---|---|---|---|---|---|---|
| GSE15526 | SRRM1 | 10250 | 0 | 5 | 25 | |
| GSE20123 | SRRM1 | 10250 | 0 | 4 | 26 | |
| GSE43470 | SRRM1 | 10250 | 2 | 6 | 35 | |
| GSE46452 | SRRM1 | 10250 | 5 | 1 | 53 | |
| GSE47630 | SRRM1 | 10250 | 8 | 3 | 29 | |
| GSE54993 | SRRM1 | 10250 | 2 | 1 | 67 | |
| GSE54994 | SRRM1 | 10250 | 11 | 4 | 38 | |
| GSE60625 | SRRM1 | 10250 | 0 | 0 | 11 | |
| GSE74703 | SRRM1 | 10250 | 1 | 4 | 31 | |
| GSE74704 | SRRM1 | 10250 | 0 | 0 | 20 | |
| TCGA | SRRM1 | 10250 | 10 | 23 | 63 |
Total number of gains: 39; Total number of losses: 51; Total Number of normals: 398.
Somatic mutations of SRRM1:
Generating mutation plots.
Highly correlated genes for SRRM1:
Showing top 20/276 corelated genes with mean PCC>0.5.
| Gene1 | Gene2 | Mean PCC | Num. Datasets | Num. PCC<0 | Num. PCC>0.5 |
|---|---|---|---|---|---|
| SRRM1 | SRP68 | 0.85858 | 3 | 0 | 3 |
| SRRM1 | SLC25A10 | 0.844347 | 3 | 0 | 3 |
| SRRM1 | STK38 | 0.806061 | 3 | 0 | 3 |
| SRRM1 | PIGN | 0.80304 | 3 | 0 | 3 |
| SRRM1 | ACP6 | 0.802012 | 3 | 0 | 3 |
| SRRM1 | SLC44A4 | 0.796791 | 3 | 0 | 3 |
| SRRM1 | MKRN1 | 0.793092 | 3 | 0 | 3 |
| SRRM1 | GLUD2 | 0.79154 | 3 | 0 | 3 |
| SRRM1 | CSNK1D | 0.787681 | 3 | 0 | 3 |
| SRRM1 | TLE4 | 0.750729 | 3 | 0 | 3 |
| SRRM1 | USP37 | 0.74803 | 3 | 0 | 3 |
| SRRM1 | CTCF | 0.748011 | 3 | 0 | 3 |
| SRRM1 | ZNF506 | 0.73658 | 3 | 0 | 3 |
| SRRM1 | ZFP37 | 0.735873 | 3 | 0 | 3 |
| SRRM1 | ERCC6 | 0.728469 | 3 | 0 | 3 |
| SRRM1 | PXMP2 | 0.7259 | 3 | 0 | 3 |
| SRRM1 | MCPH1 | 0.720157 | 3 | 0 | 3 |
| SRRM1 | SAP130 | 0.718717 | 3 | 0 | 3 |
| SRRM1 | DNAJC11 | 0.715387 | 3 | 0 | 3 |
| SRRM1 | TAB3 | 0.714694 | 3 | 0 | 3 |
For details and further investigation, click here