| Full name: phospholipase A2 group IB | Alias Symbol: | ||
| Type: protein-coding gene | Cytoband: 12q24.31 | ||
| Entrez ID: 5319 | HGNC ID: HGNC:9030 | Ensembl Gene: ENSG00000170890 | OMIM ID: 172410 |
| Related drugs: AMITRIPTYLINE, CLOBETASOL, CLOCORTOLONE ACETATE, DESONIDE, DESOXIMETASONE, DIFLORASONE, ETOPOSIDE, ETRETINATE, HALOBETASOL PROPIONATE, HYDROCORTAMATE... [more] | |||
PLA2G1B involved pathways:
| KEGG pathway | Description | View |
|---|---|---|
| hsa04014 | Ras signaling pathway | |
| hsa04270 | Vascular smooth muscle contraction |
Expression of PLA2G1B:
| Dataset | Gene | EntrezID | Probe | Log2FC | Adj.pValue | Expression |
|---|---|---|---|---|---|---|
| GSE17351 | PLA2G1B | 5319 | 206311_s_at | -0.1164 | 0.6314 | |
| GSE20347 | PLA2G1B | 5319 | 206311_s_at | -0.0475 | 0.4056 | |
| GSE23400 | PLA2G1B | 5319 | 206311_s_at | -0.1692 | 0.0068 | |
| GSE26886 | PLA2G1B | 5319 | 206311_s_at | -0.1244 | 0.2052 | |
| GSE29001 | PLA2G1B | 5319 | 206311_s_at | -0.1514 | 0.1693 | |
| GSE38129 | PLA2G1B | 5319 | 206311_s_at | -0.1663 | 0.1780 | |
| GSE45670 | PLA2G1B | 5319 | 206311_s_at | 0.0420 | 0.7303 | |
| GSE53622 | PLA2G1B | 5319 | 6499 | 0.0599 | 0.7862 | |
| GSE53624 | PLA2G1B | 5319 | 6499 | -0.1385 | 0.5145 | |
| GSE63941 | PLA2G1B | 5319 | 206311_s_at | -0.1284 | 0.2530 | |
| GSE77861 | PLA2G1B | 5319 | 206311_s_at | -0.1252 | 0.1609 | |
| TCGA | PLA2G1B | 5319 | RNAseq | -5.7937 | 0.0000 |
Upregulated datasets: 0; Downregulated datasets: 1.
Survival by PLA2G1B expression:
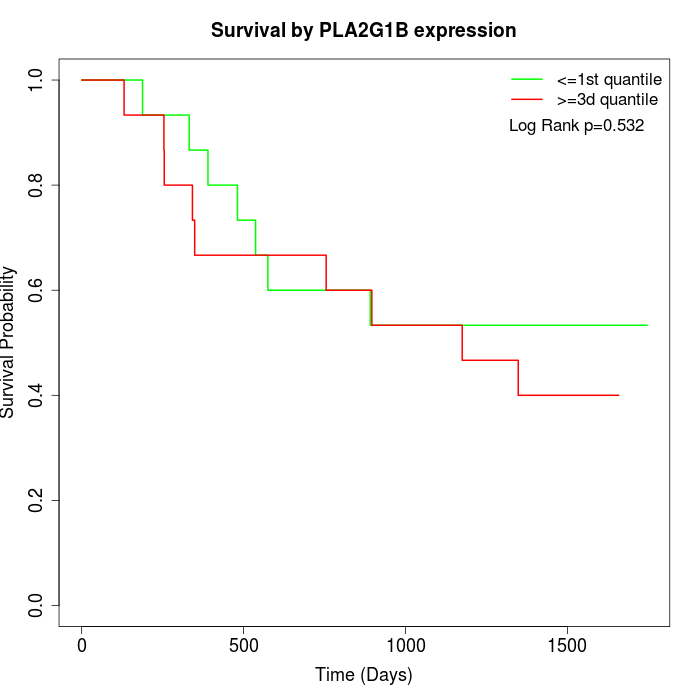 | 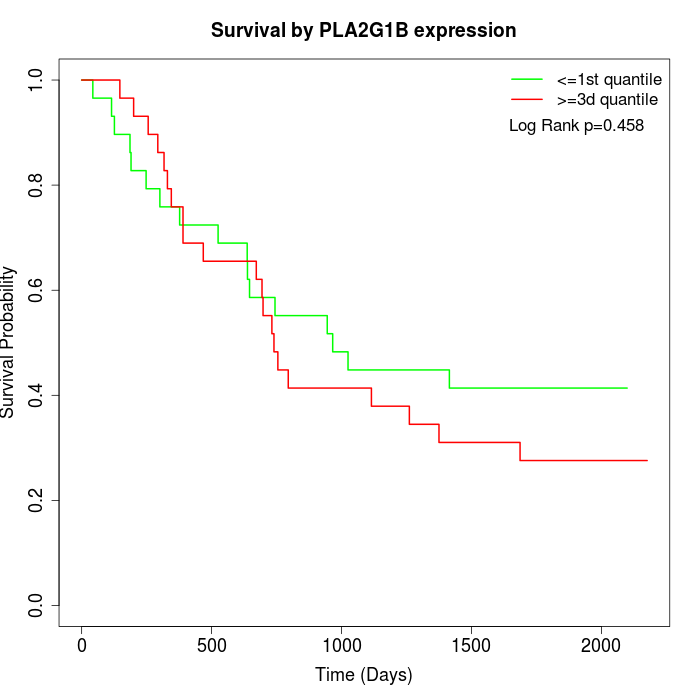 | 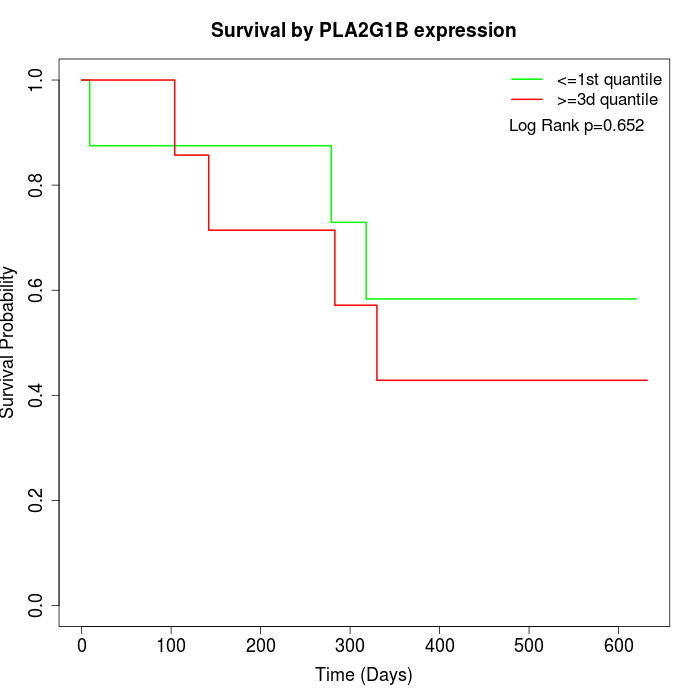 |
| GSE53622 | GSE53624 | TCGA |
Note: Click image to view full size file.
Copy number change of PLA2G1B:
| Dataset | Gene | EntrezID | Gain | Loss | Normal | Detail |
|---|---|---|---|---|---|---|
| GSE15526 | PLA2G1B | 5319 | 6 | 2 | 22 | |
| GSE20123 | PLA2G1B | 5319 | 6 | 2 | 22 | |
| GSE43470 | PLA2G1B | 5319 | 2 | 2 | 39 | |
| GSE46452 | PLA2G1B | 5319 | 9 | 1 | 49 | |
| GSE47630 | PLA2G1B | 5319 | 9 | 3 | 28 | |
| GSE54993 | PLA2G1B | 5319 | 0 | 5 | 65 | |
| GSE54994 | PLA2G1B | 5319 | 7 | 6 | 40 | |
| GSE60625 | PLA2G1B | 5319 | 0 | 0 | 11 | |
| GSE74703 | PLA2G1B | 5319 | 2 | 1 | 33 | |
| GSE74704 | PLA2G1B | 5319 | 3 | 2 | 15 | |
| TCGA | PLA2G1B | 5319 | 21 | 10 | 65 |
Total number of gains: 65; Total number of losses: 34; Total Number of normals: 389.
Somatic mutations of PLA2G1B:
Generating mutation plots.
Highly correlated genes for PLA2G1B:
Showing top 20/121 corelated genes with mean PCC>0.5.
| Gene1 | Gene2 | Mean PCC | Num. Datasets | Num. PCC<0 | Num. PCC>0.5 |
|---|---|---|---|---|---|
| PLA2G1B | MTAP | 0.678457 | 3 | 0 | 3 |
| PLA2G1B | KIR2DS5 | 0.671473 | 3 | 0 | 3 |
| PLA2G1B | RBFADN | 0.669053 | 3 | 0 | 3 |
| PLA2G1B | SERPINA4 | 0.665623 | 4 | 0 | 3 |
| PLA2G1B | COX6A2 | 0.658258 | 4 | 0 | 3 |
| PLA2G1B | REG3G | 0.651207 | 3 | 0 | 3 |
| PLA2G1B | ATP4B | 0.648496 | 6 | 0 | 6 |
| PLA2G1B | KCNA10 | 0.645495 | 3 | 0 | 3 |
| PLA2G1B | GRPR | 0.641831 | 3 | 0 | 3 |
| PLA2G1B | HTR1E | 0.641168 | 4 | 0 | 3 |
| PLA2G1B | LGALS4 | 0.640861 | 4 | 0 | 3 |
| PLA2G1B | TGM4 | 0.640791 | 3 | 0 | 3 |
| PLA2G1B | SPINT3 | 0.640139 | 4 | 0 | 4 |
| PLA2G1B | PDYN | 0.639945 | 3 | 0 | 3 |
| PLA2G1B | HCG9 | 0.63988 | 3 | 0 | 3 |
| PLA2G1B | FGF23 | 0.639352 | 4 | 0 | 4 |
| PLA2G1B | NXPH3 | 0.638584 | 4 | 0 | 3 |
| PLA2G1B | IFNA10 | 0.636721 | 4 | 0 | 3 |
| PLA2G1B | ZMAT4 | 0.635527 | 3 | 0 | 3 |
| PLA2G1B | SULT1C2 | 0.635033 | 5 | 0 | 4 |
For details and further investigation, click here