| Full name: plexin B1 | Alias Symbol: SEP|KIAA0407 | ||
| Type: protein-coding gene | Cytoband: 3p21.31 | ||
| Entrez ID: 5364 | HGNC ID: HGNC:9103 | Ensembl Gene: ENSG00000164050 | OMIM ID: 601053 |
PLXNB1 involved pathways:
| KEGG pathway | Description | View |
|---|---|---|
| hsa04360 | Axon guidance |
Expression of PLXNB1:
| Dataset | Gene | EntrezID | Probe | Log2FC | Adj.pValue | Expression |
|---|---|---|---|---|---|---|
| GSE17351 | PLXNB1 | 5364 | 215807_s_at | -0.0399 | 0.9575 | |
| GSE20347 | PLXNB1 | 5364 | 215807_s_at | -0.4073 | 0.0062 | |
| GSE23400 | PLXNB1 | 5364 | 215807_s_at | -0.2126 | 0.0182 | |
| GSE26886 | PLXNB1 | 5364 | 215807_s_at | -0.8646 | 0.0000 | |
| GSE29001 | PLXNB1 | 5364 | 215668_s_at | -0.2012 | 0.2651 | |
| GSE38129 | PLXNB1 | 5364 | 215807_s_at | -0.2635 | 0.0533 | |
| GSE45670 | PLXNB1 | 5364 | 215807_s_at | -0.1236 | 0.3807 | |
| GSE53622 | PLXNB1 | 5364 | 20558 | -0.7516 | 0.0000 | |
| GSE53624 | PLXNB1 | 5364 | 20558 | -1.6364 | 0.0000 | |
| GSE63941 | PLXNB1 | 5364 | 215807_s_at | 0.1497 | 0.7782 | |
| GSE77861 | PLXNB1 | 5364 | 215807_s_at | -0.0627 | 0.8462 | |
| GSE97050 | PLXNB1 | 5364 | A_23_P57961 | -0.4103 | 0.2731 | |
| SRP007169 | PLXNB1 | 5364 | RNAseq | -0.2627 | 0.4084 | |
| SRP008496 | PLXNB1 | 5364 | RNAseq | 0.0161 | 0.9305 | |
| SRP064894 | PLXNB1 | 5364 | RNAseq | -0.4268 | 0.0363 | |
| SRP133303 | PLXNB1 | 5364 | RNAseq | -0.8906 | 0.0000 | |
| SRP159526 | PLXNB1 | 5364 | RNAseq | -0.2310 | 0.5711 | |
| SRP193095 | PLXNB1 | 5364 | RNAseq | -0.2700 | 0.1171 | |
| SRP219564 | PLXNB1 | 5364 | RNAseq | -0.6578 | 0.2586 | |
| TCGA | PLXNB1 | 5364 | RNAseq | -0.0757 | 0.1545 |
Upregulated datasets: 0; Downregulated datasets: 1.
Survival by PLXNB1 expression:
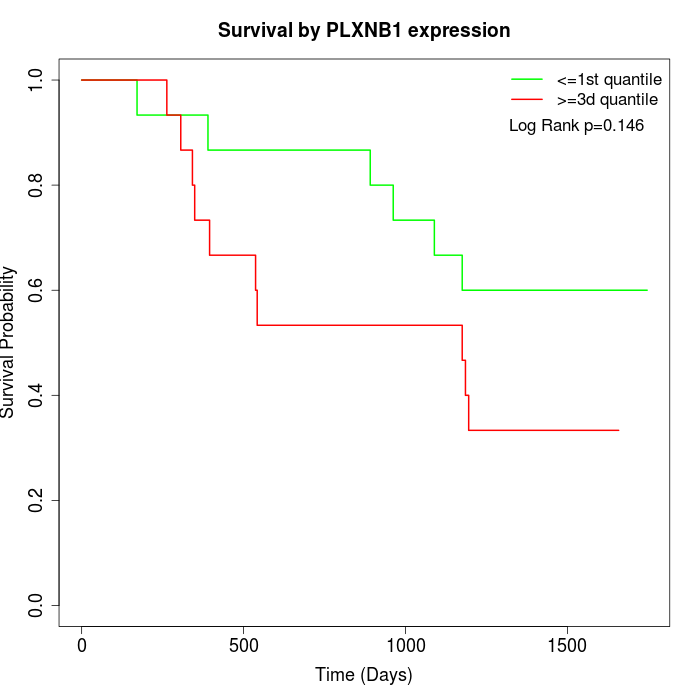 | 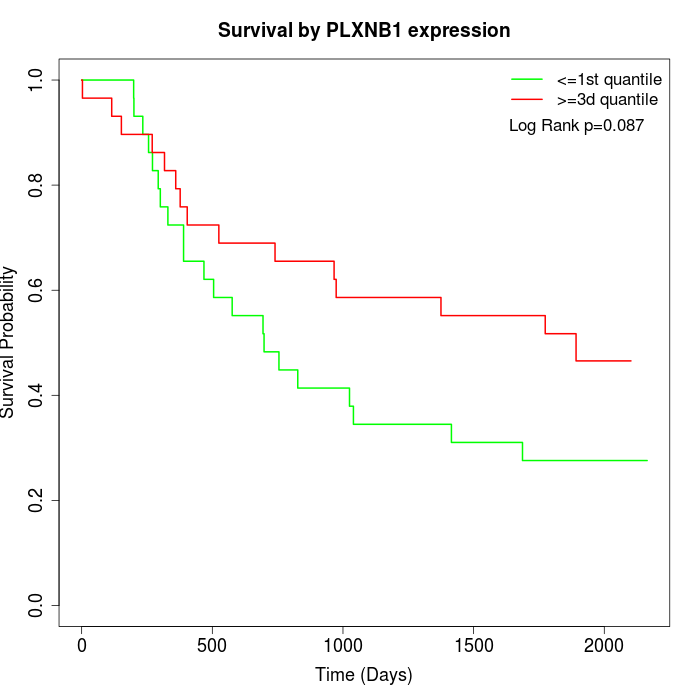 | 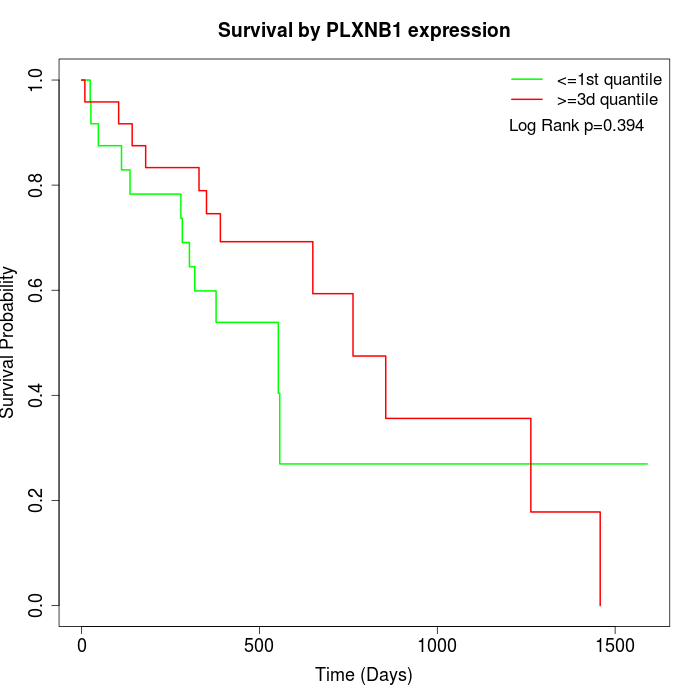 |
| GSE53622 | GSE53624 | TCGA |
Note: Click image to view full size file.
Copy number change of PLXNB1:
| Dataset | Gene | EntrezID | Gain | Loss | Normal | Detail |
|---|---|---|---|---|---|---|
| GSE15526 | PLXNB1 | 5364 | 0 | 18 | 12 | |
| GSE20123 | PLXNB1 | 5364 | 0 | 19 | 11 | |
| GSE43470 | PLXNB1 | 5364 | 0 | 19 | 24 | |
| GSE46452 | PLXNB1 | 5364 | 2 | 17 | 40 | |
| GSE47630 | PLXNB1 | 5364 | 1 | 24 | 15 | |
| GSE54993 | PLXNB1 | 5364 | 6 | 2 | 62 | |
| GSE54994 | PLXNB1 | 5364 | 0 | 36 | 17 | |
| GSE60625 | PLXNB1 | 5364 | 5 | 0 | 6 | |
| GSE74703 | PLXNB1 | 5364 | 0 | 15 | 21 | |
| GSE74704 | PLXNB1 | 5364 | 0 | 12 | 8 | |
| TCGA | PLXNB1 | 5364 | 0 | 77 | 19 |
Total number of gains: 14; Total number of losses: 239; Total Number of normals: 235.
Somatic mutations of PLXNB1:
Generating mutation plots.
Highly correlated genes for PLXNB1:
Showing top 20/640 corelated genes with mean PCC>0.5.
| Gene1 | Gene2 | Mean PCC | Num. Datasets | Num. PCC<0 | Num. PCC>0.5 |
|---|---|---|---|---|---|
| PLXNB1 | ASH1L | 0.848128 | 3 | 0 | 3 |
| PLXNB1 | NTNG1 | 0.771262 | 3 | 0 | 3 |
| PLXNB1 | TNPO3 | 0.751556 | 3 | 0 | 3 |
| PLXNB1 | STX19 | 0.751322 | 3 | 0 | 3 |
| PLXNB1 | HMGCL | 0.742908 | 3 | 0 | 3 |
| PLXNB1 | NRL | 0.73029 | 3 | 0 | 3 |
| PLXNB1 | TRAPPC2 | 0.730007 | 3 | 0 | 3 |
| PLXNB1 | MSL3 | 0.718488 | 3 | 0 | 3 |
| PLXNB1 | C6orf136 | 0.718389 | 4 | 0 | 3 |
| PLXNB1 | CDX1 | 0.716687 | 4 | 0 | 4 |
| PLXNB1 | CGNL1 | 0.713835 | 4 | 0 | 4 |
| PLXNB1 | KDM5C | 0.713723 | 3 | 0 | 3 |
| PLXNB1 | SPIN3 | 0.713311 | 3 | 0 | 3 |
| PLXNB1 | FAM13C | 0.712912 | 3 | 0 | 3 |
| PLXNB1 | CASC3 | 0.712028 | 3 | 0 | 3 |
| PLXNB1 | MORN3 | 0.710109 | 3 | 0 | 3 |
| PLXNB1 | GOLGA6L9 | 0.709515 | 3 | 0 | 3 |
| PLXNB1 | SFRP5 | 0.707668 | 3 | 0 | 3 |
| PLXNB1 | ALKBH8 | 0.707538 | 3 | 0 | 3 |
| PLXNB1 | GRIA4 | 0.707344 | 3 | 0 | 3 |
For details and further investigation, click here