| Full name: PML-RARA regulated adaptor molecule 1 | Alias Symbol: PML-RAR | ||
| Type: protein-coding gene | Cytoband: 19p13.2 | ||
| Entrez ID: 84106 | HGNC ID: HGNC:30091 | Ensembl Gene: ENSG00000133246 | OMIM ID: 606466 |
Expression of PRAM1:
| Dataset | Gene | EntrezID | Probe | Log2FC | Adj.pValue | Expression |
|---|---|---|---|---|---|---|
| GSE17351 | PRAM1 | 84106 | 241742_at | 0.2134 | 0.3378 | |
| GSE26886 | PRAM1 | 84106 | 241742_at | 0.3408 | 0.0202 | |
| GSE45670 | PRAM1 | 84106 | 241742_at | 0.0515 | 0.6944 | |
| GSE53622 | PRAM1 | 84106 | 647 | -0.0392 | 0.5191 | |
| GSE53624 | PRAM1 | 84106 | 647 | 0.2212 | 0.0004 | |
| GSE63941 | PRAM1 | 84106 | 241742_at | 0.4079 | 0.0642 | |
| GSE77861 | PRAM1 | 84106 | 241742_at | -0.0810 | 0.6108 | |
| GSE97050 | PRAM1 | 84106 | A_33_P3330608 | -0.2009 | 0.3890 | |
| SRP064894 | PRAM1 | 84106 | RNAseq | 1.1895 | 0.0013 | |
| SRP133303 | PRAM1 | 84106 | RNAseq | 0.0442 | 0.8821 | |
| SRP159526 | PRAM1 | 84106 | RNAseq | -0.0039 | 0.9942 | |
| SRP219564 | PRAM1 | 84106 | RNAseq | 0.9897 | 0.0555 | |
| TCGA | PRAM1 | 84106 | RNAseq | 0.4408 | 0.0899 |
Upregulated datasets: 1; Downregulated datasets: 0.
Survival by PRAM1 expression:
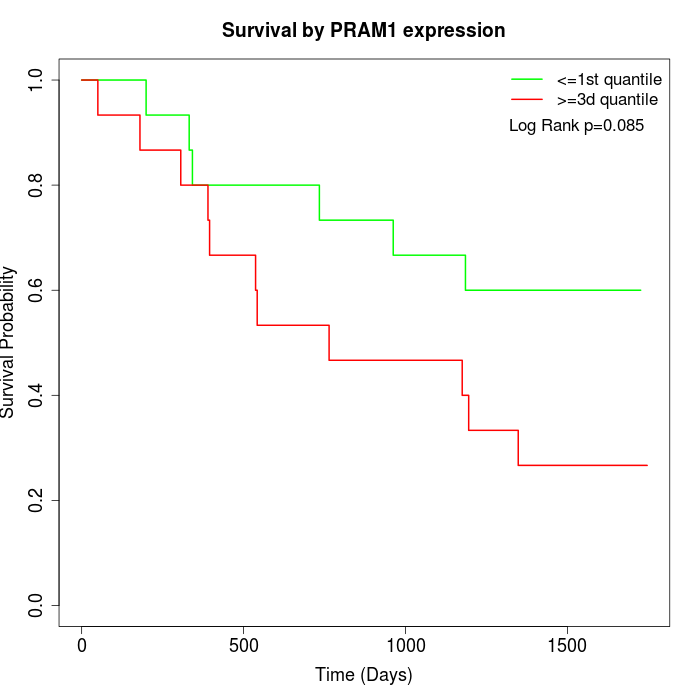 | 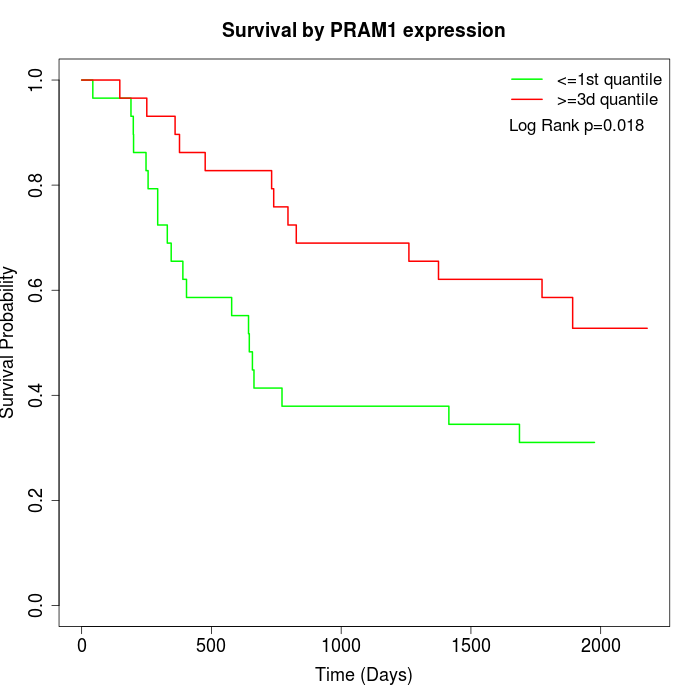 |  |
| GSE53622 | GSE53624 | TCGA |
Note: Click image to view full size file.
Copy number change of PRAM1:
| Dataset | Gene | EntrezID | Gain | Loss | Normal | Detail |
|---|---|---|---|---|---|---|
| GSE15526 | PRAM1 | 84106 | 4 | 3 | 23 | |
| GSE20123 | PRAM1 | 84106 | 3 | 2 | 25 | |
| GSE43470 | PRAM1 | 84106 | 2 | 6 | 35 | |
| GSE46452 | PRAM1 | 84106 | 47 | 1 | 11 | |
| GSE47630 | PRAM1 | 84106 | 5 | 7 | 28 | |
| GSE54993 | PRAM1 | 84106 | 16 | 3 | 51 | |
| GSE54994 | PRAM1 | 84106 | 6 | 14 | 33 | |
| GSE60625 | PRAM1 | 84106 | 9 | 0 | 2 | |
| GSE74703 | PRAM1 | 84106 | 2 | 4 | 30 | |
| GSE74704 | PRAM1 | 84106 | 0 | 2 | 18 | |
| TCGA | PRAM1 | 84106 | 10 | 19 | 67 |
Total number of gains: 104; Total number of losses: 61; Total Number of normals: 323.
Somatic mutations of PRAM1:
Generating mutation plots.
Highly correlated genes for PRAM1:
Showing top 20/278 corelated genes with mean PCC>0.5.
| Gene1 | Gene2 | Mean PCC | Num. Datasets | Num. PCC<0 | Num. PCC>0.5 |
|---|---|---|---|---|---|
| PRAM1 | GAS6-AS1 | 0.79306 | 3 | 0 | 3 |
| PRAM1 | FRS3 | 0.766414 | 3 | 0 | 3 |
| PRAM1 | FBXL8 | 0.761055 | 3 | 0 | 3 |
| PRAM1 | VCX2 | 0.72952 | 3 | 0 | 3 |
| PRAM1 | AMN | 0.716648 | 3 | 0 | 3 |
| PRAM1 | FOXH1 | 0.711074 | 3 | 0 | 3 |
| PRAM1 | TMEM221 | 0.699949 | 3 | 0 | 3 |
| PRAM1 | STX1A | 0.694999 | 3 | 0 | 3 |
| PRAM1 | TSPAN32 | 0.69439 | 3 | 0 | 3 |
| PRAM1 | CA5A | 0.685204 | 4 | 0 | 3 |
| PRAM1 | HDAC10 | 0.684731 | 4 | 0 | 3 |
| PRAM1 | PRDM12 | 0.68061 | 3 | 0 | 3 |
| PRAM1 | CRYBB1 | 0.680188 | 3 | 0 | 3 |
| PRAM1 | PRDM13 | 0.67969 | 3 | 0 | 3 |
| PRAM1 | CMTM1 | 0.679196 | 3 | 0 | 3 |
| PRAM1 | ARMC5 | 0.679187 | 4 | 0 | 3 |
| PRAM1 | THEM5 | 0.667086 | 3 | 0 | 3 |
| PRAM1 | LRFN2 | 0.66694 | 3 | 0 | 3 |
| PRAM1 | ZNF646 | 0.663278 | 5 | 0 | 4 |
| PRAM1 | DUX1 | 0.660521 | 3 | 0 | 3 |
For details and further investigation, click here