| Full name: proline-serine-threonine phosphatase interacting protein 1 | Alias Symbol: PSTPIP|CD2BP1L|CD2BP1|CD2BP1S|H-PIP|PAPAS | ||
| Type: protein-coding gene | Cytoband: 15q24.3 | ||
| Entrez ID: 9051 | HGNC ID: HGNC:9580 | Ensembl Gene: ENSG00000140368 | OMIM ID: 606347 |
| Drug and gene relationship at DGIdb | |||
PSTPIP1 involved pathways:
| KEGG pathway | Description | View |
|---|---|---|
| hsa04621 | NOD-like receptor signaling pathway |
Expression of PSTPIP1:
| Dataset | Gene | EntrezID | Probe | Log2FC | Adj.pValue | Expression |
|---|---|---|---|---|---|---|
| GSE17351 | PSTPIP1 | 9051 | 211178_s_at | 0.4578 | 0.3483 | |
| GSE20347 | PSTPIP1 | 9051 | 211178_s_at | 0.1105 | 0.2842 | |
| GSE23400 | PSTPIP1 | 9051 | 211178_s_at | -0.0695 | 0.1537 | |
| GSE26886 | PSTPIP1 | 9051 | 211178_s_at | 0.5442 | 0.0067 | |
| GSE29001 | PSTPIP1 | 9051 | 211178_s_at | 0.1643 | 0.2129 | |
| GSE38129 | PSTPIP1 | 9051 | 211178_s_at | 0.0310 | 0.8186 | |
| GSE45670 | PSTPIP1 | 9051 | 211178_s_at | 0.0360 | 0.8222 | |
| GSE53622 | PSTPIP1 | 9051 | 109801 | 0.2672 | 0.0000 | |
| GSE53624 | PSTPIP1 | 9051 | 109801 | -0.0011 | 0.9888 | |
| GSE63941 | PSTPIP1 | 9051 | 211178_s_at | 0.1252 | 0.4571 | |
| GSE77861 | PSTPIP1 | 9051 | 211178_s_at | -0.1896 | 0.1112 | |
| GSE97050 | PSTPIP1 | 9051 | A_23_P48997 | 0.0183 | 0.9516 | |
| SRP064894 | PSTPIP1 | 9051 | RNAseq | 1.0419 | 0.0057 | |
| SRP133303 | PSTPIP1 | 9051 | RNAseq | -0.2318 | 0.3000 | |
| SRP159526 | PSTPIP1 | 9051 | RNAseq | -0.2749 | 0.7300 | |
| SRP193095 | PSTPIP1 | 9051 | RNAseq | 0.6327 | 0.0131 | |
| SRP219564 | PSTPIP1 | 9051 | RNAseq | 0.4798 | 0.3651 | |
| TCGA | PSTPIP1 | 9051 | RNAseq | 0.5280 | 0.0057 |
Upregulated datasets: 1; Downregulated datasets: 0.
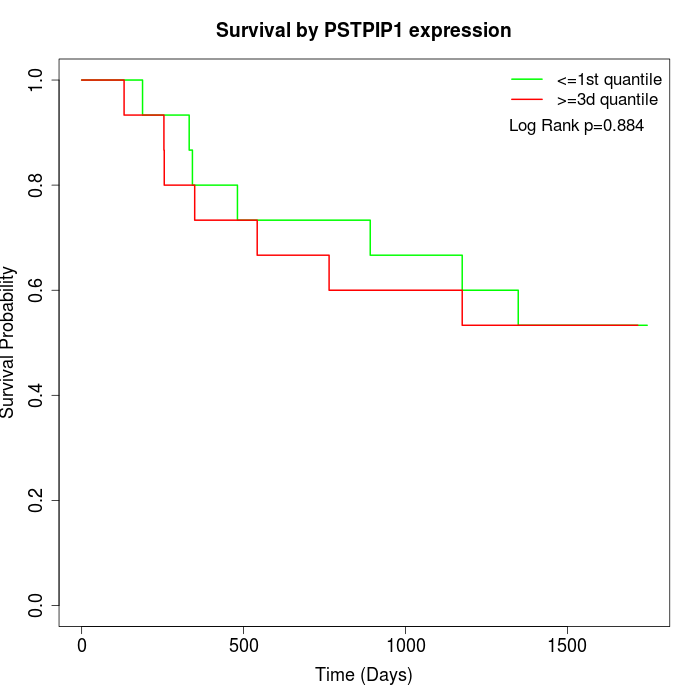
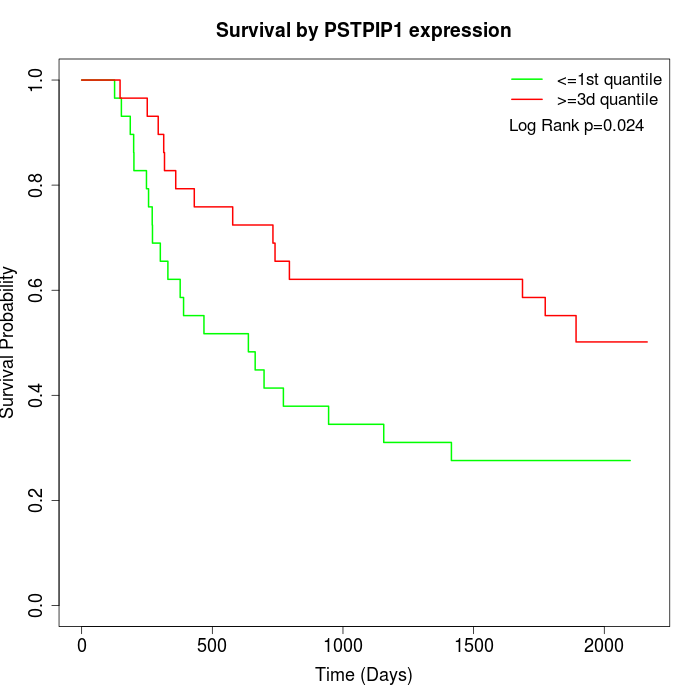
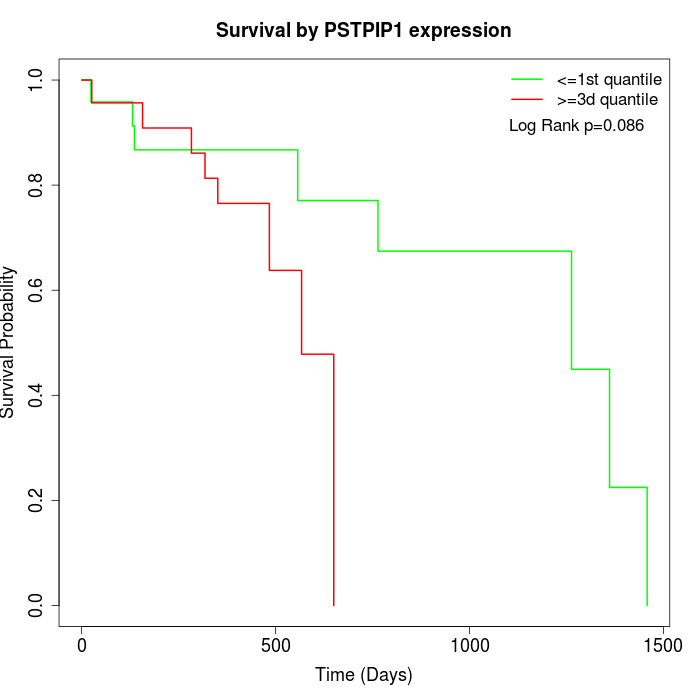
Survival by PSTPIP1 expression:
Note: Click image to view full size file.
Copy number change of PSTPIP1:
| Dataset | Gene | EntrezID | Gain | Loss | Normal | Detail |
|---|---|---|---|---|---|---|
| GSE15526 | PSTPIP1 | 9051 | 8 | 2 | 20 | |
| GSE20123 | PSTPIP1 | 9051 | 8 | 2 | 20 | |
| GSE43470 | PSTPIP1 | 9051 | 4 | 5 | 34 | |
| GSE46452 | PSTPIP1 | 9051 | 3 | 7 | 49 | |
| GSE47630 | PSTPIP1 | 9051 | 8 | 10 | 22 | |
| GSE54993 | PSTPIP1 | 9051 | 5 | 6 | 59 | |
| GSE54994 | PSTPIP1 | 9051 | 5 | 6 | 42 | |
| GSE60625 | PSTPIP1 | 9051 | 4 | 0 | 7 | |
| GSE74703 | PSTPIP1 | 9051 | 4 | 3 | 29 | |
| GSE74704 | PSTPIP1 | 9051 | 4 | 2 | 14 | |
| TCGA | PSTPIP1 | 9051 | 15 | 15 | 66 |
Total number of gains: 68; Total number of losses: 58; Total Number of normals: 362.
Somatic mutations of PSTPIP1:
Generating mutation plots.
Highly correlated genes for PSTPIP1:
Showing top 20/337 corelated genes with mean PCC>0.5.
| Gene1 | Gene2 | Mean PCC | Num. Datasets | Num. PCC<0 | Num. PCC>0.5 |
|---|---|---|---|---|---|
| PSTPIP1 | DCDC1 | 0.773582 | 3 | 0 | 3 |
| PSTPIP1 | BATF2 | 0.771382 | 3 | 0 | 3 |
| PSTPIP1 | TBC1D10C | 0.754422 | 4 | 0 | 4 |
| PSTPIP1 | CEMP1 | 0.744703 | 3 | 0 | 3 |
| PSTPIP1 | GRIK4 | 0.742752 | 3 | 0 | 3 |
| PSTPIP1 | PLA2G2C | 0.726736 | 3 | 0 | 3 |
| PSTPIP1 | BBC3 | 0.724555 | 3 | 0 | 3 |
| PSTPIP1 | YY2 | 0.72443 | 3 | 0 | 3 |
| PSTPIP1 | CHD5 | 0.723023 | 4 | 0 | 4 |
| PSTPIP1 | LRFN1 | 0.722784 | 4 | 0 | 4 |
| PSTPIP1 | C1QL2 | 0.722399 | 3 | 0 | 3 |
| PSTPIP1 | ZDHHC8 | 0.722037 | 3 | 0 | 3 |
| PSTPIP1 | SIRT6 | 0.719507 | 3 | 0 | 3 |
| PSTPIP1 | ZGLP1 | 0.717749 | 3 | 0 | 3 |
| PSTPIP1 | GPR182 | 0.713554 | 4 | 0 | 4 |
| PSTPIP1 | RELB | 0.713188 | 3 | 0 | 3 |
| PSTPIP1 | DGKZ | 0.711713 | 4 | 0 | 3 |
| PSTPIP1 | ZNF341 | 0.711611 | 4 | 0 | 3 |
| PSTPIP1 | LRRC3 | 0.709241 | 3 | 0 | 3 |
| PSTPIP1 | OR2A5 | 0.707053 | 3 | 0 | 3 |
For details and further investigation, click here


