| Full name: polypyrimidine tract binding protein 2 | Alias Symbol: brPTB|nPTB|PTB|PTBLP | ||
| Type: protein-coding gene | Cytoband: 1p21.3 | ||
| Entrez ID: 58155 | HGNC ID: HGNC:17662 | Ensembl Gene: ENSG00000117569 | OMIM ID: 608449 |
Expression of PTBP2:
| Dataset | Gene | EntrezID | Probe | Log2FC | Adj.pValue | Expression |
|---|---|---|---|---|---|---|
| GSE17351 | PTBP2 | 58155 | 218683_at | -0.4985 | 0.3745 | |
| GSE20347 | PTBP2 | 58155 | 218683_at | 0.1126 | 0.6037 | |
| GSE23400 | PTBP2 | 58155 | 218683_at | 0.0045 | 0.9750 | |
| GSE26886 | PTBP2 | 58155 | 218683_at | 0.4134 | 0.0861 | |
| GSE29001 | PTBP2 | 58155 | 218683_at | 0.2176 | 0.5262 | |
| GSE38129 | PTBP2 | 58155 | 218683_at | -0.3978 | 0.0764 | |
| GSE45670 | PTBP2 | 58155 | 218683_at | -0.6257 | 0.0071 | |
| GSE53622 | PTBP2 | 58155 | 142596 | -0.2669 | 0.0191 | |
| GSE53624 | PTBP2 | 58155 | 142596 | -0.1439 | 0.0563 | |
| GSE63941 | PTBP2 | 58155 | 218683_at | -0.8188 | 0.2487 | |
| GSE77861 | PTBP2 | 58155 | 218683_at | -0.4121 | 0.1324 | |
| GSE97050 | PTBP2 | 58155 | A_23_P46396 | -0.5998 | 0.1906 | |
| SRP007169 | PTBP2 | 58155 | RNAseq | 0.3144 | 0.5529 | |
| SRP008496 | PTBP2 | 58155 | RNAseq | 0.3218 | 0.3185 | |
| SRP064894 | PTBP2 | 58155 | RNAseq | 0.1216 | 0.5526 | |
| SRP133303 | PTBP2 | 58155 | RNAseq | 0.0586 | 0.7360 | |
| SRP159526 | PTBP2 | 58155 | RNAseq | -0.2183 | 0.6577 | |
| SRP193095 | PTBP2 | 58155 | RNAseq | 0.2515 | 0.0668 | |
| SRP219564 | PTBP2 | 58155 | RNAseq | -0.4254 | 0.5116 | |
| TCGA | PTBP2 | 58155 | RNAseq | -0.2023 | 0.0272 |
Upregulated datasets: 0; Downregulated datasets: 0.
Survival by PTBP2 expression:
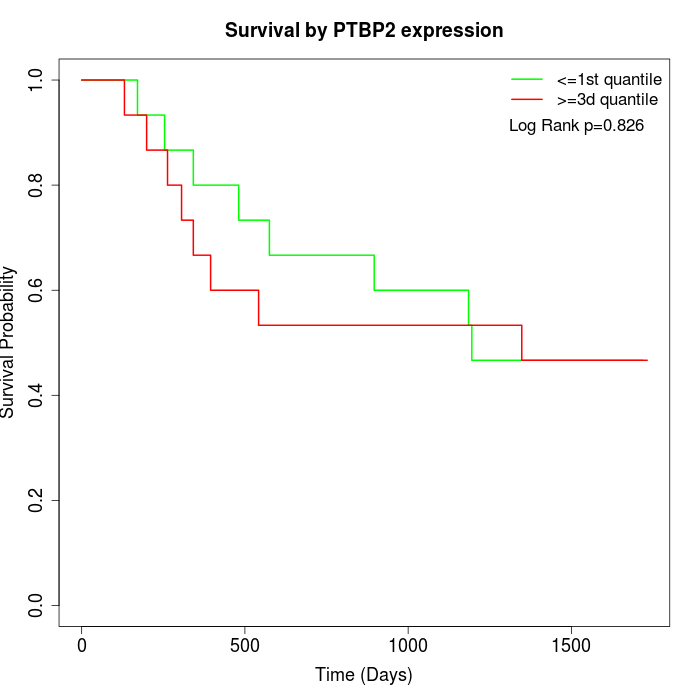 | 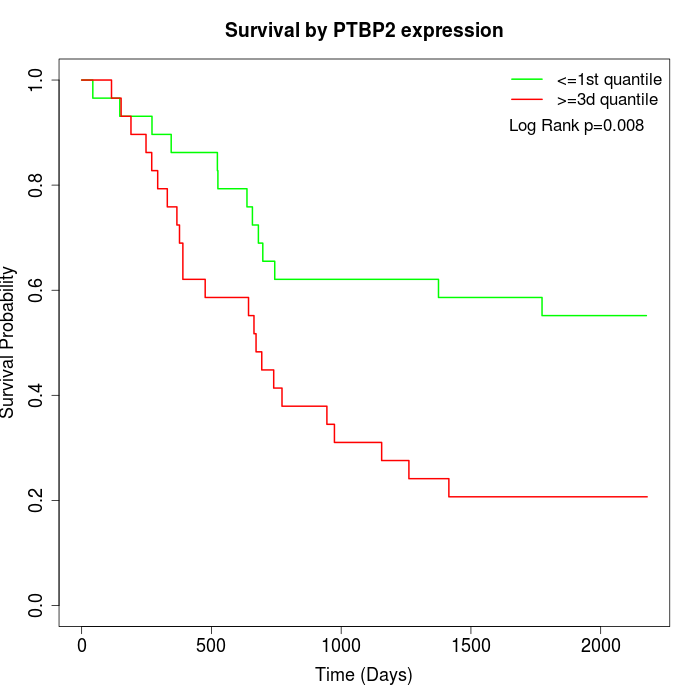 | 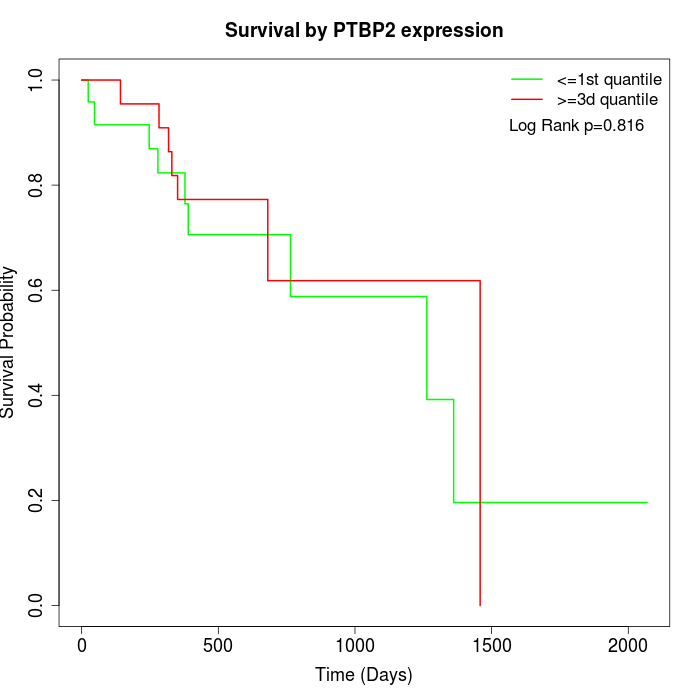 |
| GSE53622 | GSE53624 | TCGA |
Note: Click image to view full size file.
Copy number change of PTBP2:
| Dataset | Gene | EntrezID | Gain | Loss | Normal | Detail |
|---|---|---|---|---|---|---|
| GSE15526 | PTBP2 | 58155 | 0 | 9 | 21 | |
| GSE20123 | PTBP2 | 58155 | 0 | 9 | 21 | |
| GSE43470 | PTBP2 | 58155 | 2 | 6 | 35 | |
| GSE46452 | PTBP2 | 58155 | 1 | 1 | 57 | |
| GSE47630 | PTBP2 | 58155 | 8 | 5 | 27 | |
| GSE54993 | PTBP2 | 58155 | 0 | 1 | 69 | |
| GSE54994 | PTBP2 | 58155 | 6 | 3 | 44 | |
| GSE60625 | PTBP2 | 58155 | 0 | 0 | 11 | |
| GSE74703 | PTBP2 | 58155 | 1 | 5 | 30 | |
| GSE74704 | PTBP2 | 58155 | 0 | 5 | 15 | |
| TCGA | PTBP2 | 58155 | 7 | 23 | 66 |
Total number of gains: 25; Total number of losses: 67; Total Number of normals: 396.
Somatic mutations of PTBP2:
Generating mutation plots.
Highly correlated genes for PTBP2:
Showing top 20/720 corelated genes with mean PCC>0.5.
| Gene1 | Gene2 | Mean PCC | Num. Datasets | Num. PCC<0 | Num. PCC>0.5 |
|---|---|---|---|---|---|
| PTBP2 | PDCD4 | 0.807048 | 3 | 0 | 3 |
| PTBP2 | MBD5 | 0.733734 | 4 | 0 | 4 |
| PTBP2 | TSNARE1 | 0.728577 | 3 | 0 | 3 |
| PTBP2 | BHLHE22 | 0.726973 | 3 | 0 | 3 |
| PTBP2 | PLIN4 | 0.725842 | 3 | 0 | 3 |
| PTBP2 | XKR4 | 0.716943 | 4 | 0 | 4 |
| PTBP2 | PRDM5 | 0.716914 | 3 | 0 | 3 |
| PTBP2 | GKAP1 | 0.715104 | 3 | 0 | 3 |
| PTBP2 | NCAM1 | 0.713041 | 6 | 0 | 6 |
| PTBP2 | GNG12 | 0.708545 | 3 | 0 | 3 |
| PTBP2 | C20orf194 | 0.707812 | 3 | 0 | 3 |
| PTBP2 | KIAA0753 | 0.702771 | 5 | 0 | 4 |
| PTBP2 | ERRFI1 | 0.697716 | 4 | 0 | 4 |
| PTBP2 | DENND4C | 0.692818 | 3 | 0 | 3 |
| PTBP2 | FAM124A | 0.688454 | 3 | 0 | 3 |
| PTBP2 | RGS9 | 0.686975 | 4 | 0 | 4 |
| PTBP2 | ZNF449 | 0.683858 | 3 | 0 | 3 |
| PTBP2 | FNDC5 | 0.68347 | 4 | 0 | 3 |
| PTBP2 | HAND2-AS1 | 0.675958 | 5 | 0 | 5 |
| PTBP2 | GNG2 | 0.674014 | 3 | 0 | 3 |
For details and further investigation, click here