| Full name: microtubule associated monooxygenase, calponin and LIM domain containing 2 | Alias Symbol: KIAA0750 | ||
| Type: protein-coding gene | Cytoband: 11p15.3 | ||
| Entrez ID: 9645 | HGNC ID: HGNC:24693 | Ensembl Gene: ENSG00000133816 | OMIM ID: 608881 |
Expression of MICAL2:
| Dataset | Gene | EntrezID | Probe | Log2FC | Adj.pValue | Expression |
|---|---|---|---|---|---|---|
| GSE17351 | MICAL2 | 9645 | 212473_s_at | -0.1901 | 0.8999 | |
| GSE20347 | MICAL2 | 9645 | 212473_s_at | 0.9362 | 0.0063 | |
| GSE23400 | MICAL2 | 9645 | 212473_s_at | 0.4910 | 0.0126 | |
| GSE26886 | MICAL2 | 9645 | 212473_s_at | 2.2897 | 0.0000 | |
| GSE29001 | MICAL2 | 9645 | 212473_s_at | 1.1027 | 0.0211 | |
| GSE38129 | MICAL2 | 9645 | 212473_s_at | 0.4951 | 0.3809 | |
| GSE45670 | MICAL2 | 9645 | 212473_s_at | -0.5392 | 0.3369 | |
| GSE53622 | MICAL2 | 9645 | 40478 | 0.8830 | 0.0000 | |
| GSE53624 | MICAL2 | 9645 | 40478 | 1.0541 | 0.0000 | |
| GSE63941 | MICAL2 | 9645 | 212473_s_at | -2.8345 | 0.0264 | |
| GSE77861 | MICAL2 | 9645 | 206275_s_at | -0.1376 | 0.2314 | |
| GSE97050 | MICAL2 | 9645 | A_33_P3315190 | -0.1668 | 0.5260 | |
| SRP007169 | MICAL2 | 9645 | RNAseq | 3.0352 | 0.0000 | |
| SRP008496 | MICAL2 | 9645 | RNAseq | 3.0385 | 0.0000 | |
| SRP064894 | MICAL2 | 9645 | RNAseq | 0.7753 | 0.0042 | |
| SRP133303 | MICAL2 | 9645 | RNAseq | 1.7378 | 0.0000 | |
| SRP159526 | MICAL2 | 9645 | RNAseq | 0.1908 | 0.5756 | |
| SRP193095 | MICAL2 | 9645 | RNAseq | 1.2285 | 0.0003 | |
| SRP219564 | MICAL2 | 9645 | RNAseq | 0.3824 | 0.6254 | |
| TCGA | MICAL2 | 9645 | RNAseq | -0.2935 | 0.0014 |
Upregulated datasets: 7; Downregulated datasets: 1.
Survival by MICAL2 expression:
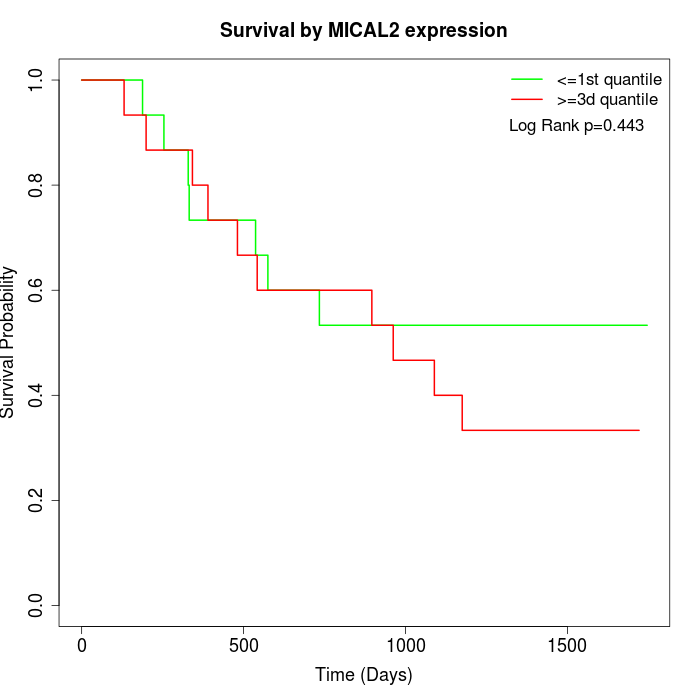 | 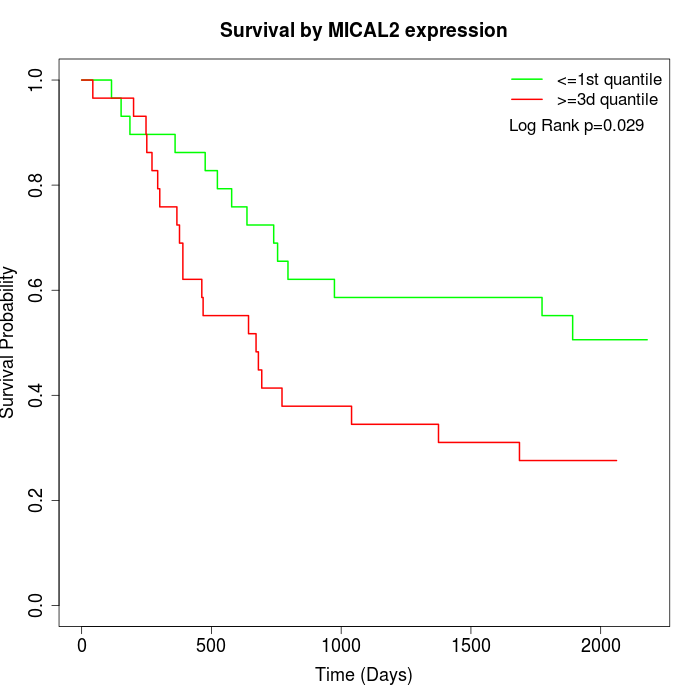 | 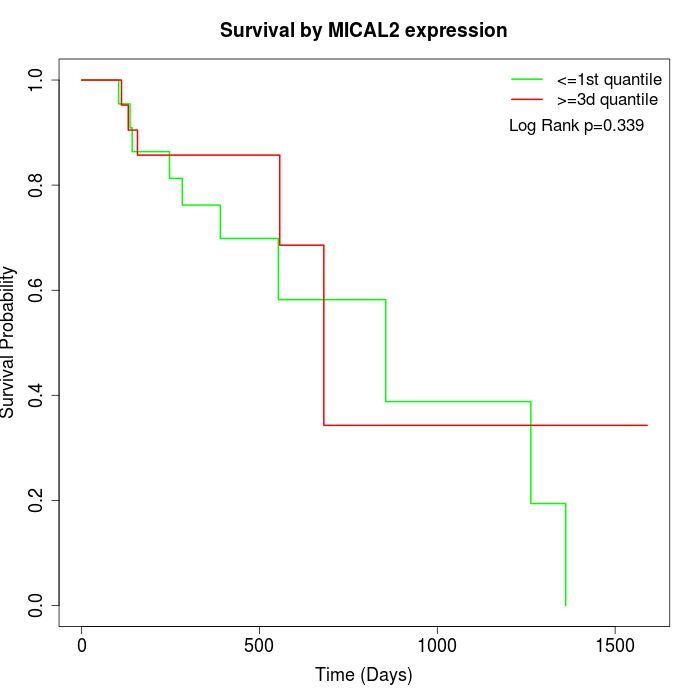 |
| GSE53622 | GSE53624 | TCGA |
Note: Click image to view full size file.
Copy number change of MICAL2:
| Dataset | Gene | EntrezID | Gain | Loss | Normal | Detail |
|---|---|---|---|---|---|---|
| GSE15526 | MICAL2 | 9645 | 0 | 9 | 21 | |
| GSE20123 | MICAL2 | 9645 | 0 | 9 | 21 | |
| GSE43470 | MICAL2 | 9645 | 1 | 5 | 37 | |
| GSE46452 | MICAL2 | 9645 | 7 | 5 | 47 | |
| GSE47630 | MICAL2 | 9645 | 3 | 11 | 26 | |
| GSE54993 | MICAL2 | 9645 | 3 | 1 | 66 | |
| GSE54994 | MICAL2 | 9645 | 4 | 12 | 37 | |
| GSE60625 | MICAL2 | 9645 | 0 | 0 | 11 | |
| GSE74703 | MICAL2 | 9645 | 1 | 3 | 32 | |
| GSE74704 | MICAL2 | 9645 | 0 | 7 | 13 | |
| TCGA | MICAL2 | 9645 | 11 | 34 | 51 |
Total number of gains: 30; Total number of losses: 96; Total Number of normals: 362.
Somatic mutations of MICAL2:
Generating mutation plots.
Highly correlated genes for MICAL2:
Showing top 20/514 corelated genes with mean PCC>0.5.
| Gene1 | Gene2 | Mean PCC | Num. Datasets | Num. PCC<0 | Num. PCC>0.5 |
|---|---|---|---|---|---|
| MICAL2 | ITGB1 | 0.783847 | 9 | 0 | 9 |
| MICAL2 | COL12A1 | 0.77641 | 6 | 0 | 6 |
| MICAL2 | LAMA4 | 0.767405 | 10 | 0 | 9 |
| MICAL2 | AEBP1 | 0.762058 | 10 | 0 | 9 |
| MICAL2 | STX2 | 0.759576 | 10 | 0 | 10 |
| MICAL2 | EMP3 | 0.759027 | 10 | 0 | 10 |
| MICAL2 | COL6A1 | 0.750741 | 11 | 0 | 10 |
| MICAL2 | FILIP1L | 0.743583 | 9 | 0 | 9 |
| MICAL2 | LGALS1 | 0.742911 | 10 | 0 | 10 |
| MICAL2 | COL6A2 | 0.742548 | 11 | 0 | 10 |
| MICAL2 | CLMP | 0.737437 | 6 | 0 | 5 |
| MICAL2 | RHOBTB1 | 0.735256 | 9 | 0 | 9 |
| MICAL2 | COL6A3 | 0.732997 | 9 | 0 | 9 |
| MICAL2 | SLC45A1 | 0.730378 | 3 | 0 | 3 |
| MICAL2 | FN1 | 0.730038 | 10 | 0 | 9 |
| MICAL2 | TGFB1I1 | 0.729787 | 10 | 0 | 9 |
| MICAL2 | SYNC | 0.727754 | 6 | 0 | 6 |
| MICAL2 | COL5A1 | 0.725275 | 9 | 0 | 9 |
| MICAL2 | NID2 | 0.723914 | 8 | 0 | 8 |
| MICAL2 | PDLIM7 | 0.722502 | 8 | 0 | 7 |
For details and further investigation, click here