| Full name: protein tyrosine phosphatase receptor type S | Alias Symbol: | ||
| Type: protein-coding gene | Cytoband: 19p13.3 | ||
| Entrez ID: 5802 | HGNC ID: HGNC:9681 | Ensembl Gene: ENSG00000105426 | OMIM ID: 601576 |
| Related drugs: ALENDRONIC ACID, ETIDRONIC ACID, OXYTETRACYCLINE CALCIUM... [more] | |||
Expression of PTPRS:
| Dataset | Gene | EntrezID | Probe | Log2FC | Adj.pValue | Expression |
|---|---|---|---|---|---|---|
| GSE20347 | PTPRS | 5802 | 210823_s_at | -0.0952 | 0.1604 | |
| GSE23400 | PTPRS | 5802 | 210823_s_at | -0.0535 | 0.0835 | |
| GSE29001 | PTPRS | 5802 | 210823_s_at | -0.1490 | 0.1799 | |
| GSE38129 | PTPRS | 5802 | 210823_s_at | -0.1100 | 0.1209 | |
| GSE45670 | PTPRS | 5802 | 226571_s_at | 0.2037 | 0.4746 | |
| GSE53622 | PTPRS | 5802 | 122369 | 0.1220 | 0.1460 | |
| GSE53624 | PTPRS | 5802 | 8097 | 0.2690 | 0.0121 | |
| GSE97050 | PTPRS | 5802 | A_33_P3414964 | -0.3920 | 0.1245 | |
| SRP007169 | PTPRS | 5802 | RNAseq | 1.5831 | 0.0019 | |
| SRP008496 | PTPRS | 5802 | RNAseq | 2.0583 | 0.0000 | |
| SRP064894 | PTPRS | 5802 | RNAseq | 0.5952 | 0.0095 | |
| SRP133303 | PTPRS | 5802 | RNAseq | -0.1451 | 0.4021 | |
| SRP159526 | PTPRS | 5802 | RNAseq | 0.7281 | 0.0248 | |
| SRP193095 | PTPRS | 5802 | RNAseq | 0.5772 | 0.0065 | |
| SRP219564 | PTPRS | 5802 | RNAseq | 0.6435 | 0.1164 | |
| TCGA | PTPRS | 5802 | RNAseq | -0.0867 | 0.2869 |
Upregulated datasets: 2; Downregulated datasets: 0.
Survival by PTPRS expression:
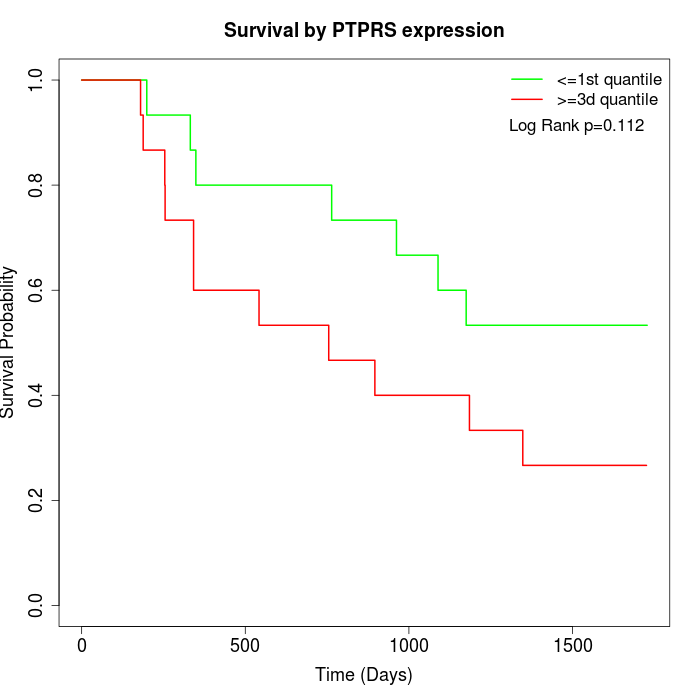 | 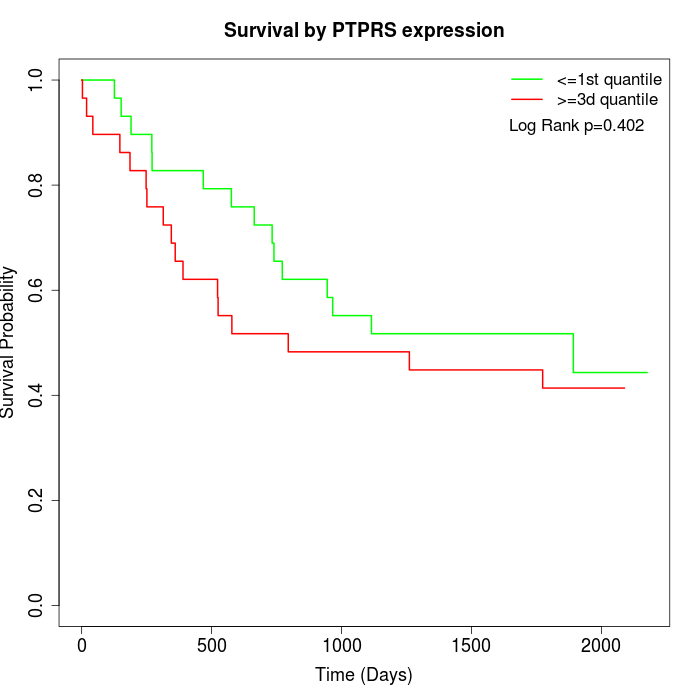 |  |
| GSE53622 | GSE53624 | TCGA |
Note: Click image to view full size file.
Copy number change of PTPRS:
| Dataset | Gene | EntrezID | Gain | Loss | Normal | Detail |
|---|---|---|---|---|---|---|
| GSE15526 | PTPRS | 5802 | 5 | 3 | 22 | |
| GSE20123 | PTPRS | 5802 | 4 | 2 | 24 | |
| GSE43470 | PTPRS | 5802 | 1 | 7 | 35 | |
| GSE46452 | PTPRS | 5802 | 47 | 1 | 11 | |
| GSE47630 | PTPRS | 5802 | 5 | 7 | 28 | |
| GSE54993 | PTPRS | 5802 | 16 | 3 | 51 | |
| GSE54994 | PTPRS | 5802 | 6 | 16 | 31 | |
| GSE60625 | PTPRS | 5802 | 9 | 0 | 2 | |
| GSE74703 | PTPRS | 5802 | 1 | 5 | 30 | |
| GSE74704 | PTPRS | 5802 | 1 | 2 | 17 | |
| TCGA | PTPRS | 5802 | 11 | 18 | 67 |
Total number of gains: 106; Total number of losses: 64; Total Number of normals: 318.
Somatic mutations of PTPRS:
Generating mutation plots.
Highly correlated genes for PTPRS:
Showing top 20/31 corelated genes with mean PCC>0.5.
| Gene1 | Gene2 | Mean PCC | Num. Datasets | Num. PCC<0 | Num. PCC>0.5 |
|---|---|---|---|---|---|
| PTPRS | HRC | 0.74854 | 3 | 0 | 3 |
| PTPRS | RAX | 0.741145 | 3 | 0 | 3 |
| PTPRS | SLC22A14 | 0.703287 | 3 | 0 | 3 |
| PTPRS | OR1F1 | 0.679386 | 3 | 0 | 3 |
| PTPRS | CNGB1 | 0.677258 | 4 | 0 | 3 |
| PTPRS | LAMB4 | 0.655763 | 3 | 0 | 3 |
| PTPRS | PNMA3 | 0.646249 | 4 | 0 | 4 |
| PTPRS | KCNQ4 | 0.638157 | 4 | 0 | 3 |
| PTPRS | FOXO4 | 0.63697 | 3 | 0 | 3 |
| PTPRS | ZNF646 | 0.634193 | 4 | 0 | 3 |
| PTPRS | TBX4 | 0.622169 | 4 | 0 | 3 |
| PTPRS | TM6SF2 | 0.621946 | 4 | 0 | 3 |
| PTPRS | ABCA2 | 0.611845 | 4 | 0 | 3 |
| PTPRS | DNAH9 | 0.61085 | 4 | 0 | 3 |
| PTPRS | SCLY | 0.608706 | 4 | 0 | 3 |
| PTPRS | TP73 | 0.608579 | 4 | 0 | 3 |
| PTPRS | EPO | 0.60121 | 3 | 0 | 3 |
| PTPRS | OR2H2 | 0.588929 | 5 | 0 | 3 |
| PTPRS | PHKG1 | 0.575351 | 3 | 0 | 3 |
| PTPRS | CELF3 | 0.570201 | 5 | 0 | 3 |
For details and further investigation, click here