| Full name: Ral GEF with PH domain and SH3 binding motif 1 | Alias Symbol: RALGPS1A|RALGEF2|KIAA0351 | ||
| Type: protein-coding gene | Cytoband: 9q33.3 | ||
| Entrez ID: 9649 | HGNC ID: HGNC:16851 | Ensembl Gene: ENSG00000136828 | OMIM ID: 614444 |
Expression of RALGPS1:
| Dataset | Gene | EntrezID | Probe | Log2FC | Adj.pValue | Expression |
|---|---|---|---|---|---|---|
| GSE17351 | RALGPS1 | 9649 | 204199_at | -1.1288 | 0.2101 | |
| GSE20347 | RALGPS1 | 9649 | 204199_at | -0.5710 | 0.0006 | |
| GSE23400 | RALGPS1 | 9649 | 204199_at | -0.3608 | 0.0000 | |
| GSE26886 | RALGPS1 | 9649 | 204199_at | -0.5767 | 0.0763 | |
| GSE29001 | RALGPS1 | 9649 | 204199_at | -0.9647 | 0.1040 | |
| GSE38129 | RALGPS1 | 9649 | 204199_at | -0.6769 | 0.0000 | |
| GSE45670 | RALGPS1 | 9649 | 204199_at | -1.1848 | 0.0019 | |
| GSE53622 | RALGPS1 | 9649 | 128592 | -1.1690 | 0.0000 | |
| GSE53624 | RALGPS1 | 9649 | 128592 | -1.1138 | 0.0000 | |
| GSE63941 | RALGPS1 | 9649 | 204199_at | 2.1354 | 0.0283 | |
| GSE77861 | RALGPS1 | 9649 | 1555452_at | -0.0759 | 0.3716 | |
| GSE97050 | RALGPS1 | 9649 | A_32_P221991 | -0.7078 | 0.1438 | |
| SRP007169 | RALGPS1 | 9649 | RNAseq | -0.9004 | 0.1481 | |
| SRP008496 | RALGPS1 | 9649 | RNAseq | -0.5484 | 0.1285 | |
| SRP064894 | RALGPS1 | 9649 | RNAseq | -1.3319 | 0.0000 | |
| SRP133303 | RALGPS1 | 9649 | RNAseq | -0.9697 | 0.0009 | |
| SRP159526 | RALGPS1 | 9649 | RNAseq | -0.4839 | 0.2202 | |
| SRP193095 | RALGPS1 | 9649 | RNAseq | -1.0193 | 0.0004 | |
| SRP219564 | RALGPS1 | 9649 | RNAseq | -1.1986 | 0.0123 | |
| TCGA | RALGPS1 | 9649 | RNAseq | -0.7279 | 0.0000 |
Upregulated datasets: 1; Downregulated datasets: 6.
Survival by RALGPS1 expression:
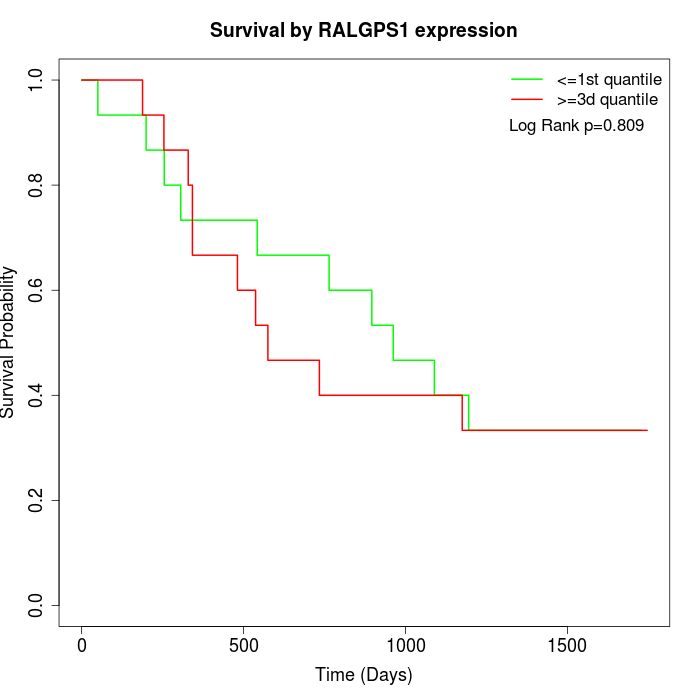 | 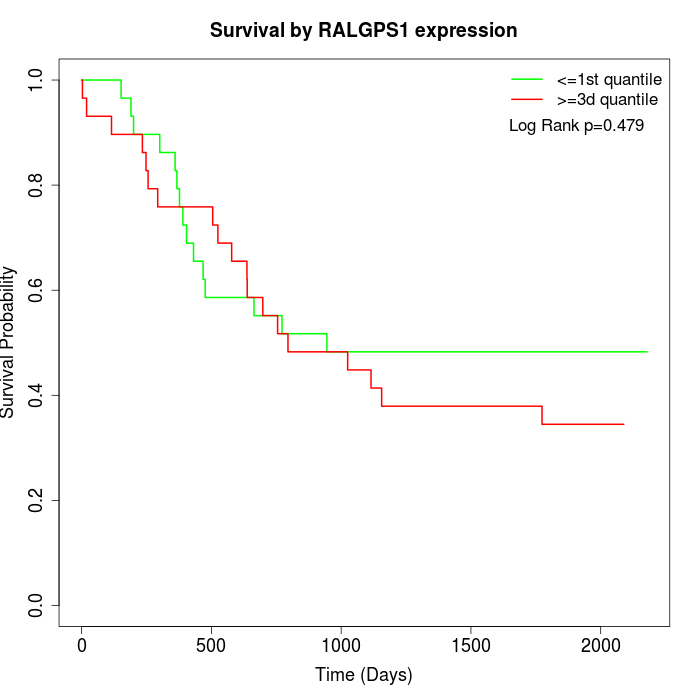 | 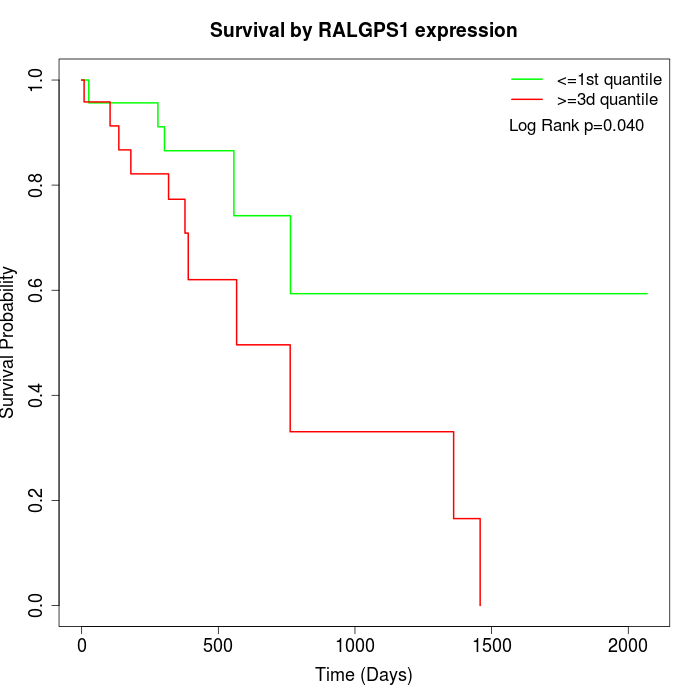 |
| GSE53622 | GSE53624 | TCGA |
Note: Click image to view full size file.
Copy number change of RALGPS1:
| Dataset | Gene | EntrezID | Gain | Loss | Normal | Detail |
|---|---|---|---|---|---|---|
| GSE15526 | RALGPS1 | 9649 | 6 | 9 | 15 | |
| GSE20123 | RALGPS1 | 9649 | 6 | 9 | 15 | |
| GSE43470 | RALGPS1 | 9649 | 6 | 6 | 31 | |
| GSE46452 | RALGPS1 | 9649 | 6 | 13 | 40 | |
| GSE47630 | RALGPS1 | 9649 | 3 | 16 | 21 | |
| GSE54993 | RALGPS1 | 9649 | 3 | 3 | 64 | |
| GSE54994 | RALGPS1 | 9649 | 12 | 8 | 33 | |
| GSE60625 | RALGPS1 | 9649 | 0 | 0 | 11 | |
| GSE74703 | RALGPS1 | 9649 | 5 | 4 | 27 | |
| GSE74704 | RALGPS1 | 9649 | 3 | 7 | 10 | |
| TCGA | RALGPS1 | 9649 | 26 | 26 | 44 |
Total number of gains: 76; Total number of losses: 101; Total Number of normals: 311.
Somatic mutations of RALGPS1:
Generating mutation plots.
Highly correlated genes for RALGPS1:
Showing top 20/791 corelated genes with mean PCC>0.5.
| Gene1 | Gene2 | Mean PCC | Num. Datasets | Num. PCC<0 | Num. PCC>0.5 |
|---|---|---|---|---|---|
| RALGPS1 | PPM1L | 0.746291 | 6 | 0 | 6 |
| RALGPS1 | TCEA3 | 0.739808 | 7 | 0 | 7 |
| RALGPS1 | CLYBL | 0.717521 | 7 | 0 | 7 |
| RALGPS1 | LYRM7 | 0.715233 | 3 | 0 | 3 |
| RALGPS1 | RNF167 | 0.706237 | 5 | 0 | 5 |
| RALGPS1 | NR1H2 | 0.705604 | 3 | 0 | 3 |
| RALGPS1 | PACRGL | 0.705365 | 3 | 0 | 3 |
| RALGPS1 | SLC10A5 | 0.697475 | 3 | 0 | 3 |
| RALGPS1 | ZNF514 | 0.696608 | 3 | 0 | 3 |
| RALGPS1 | FAM221A | 0.692823 | 5 | 0 | 5 |
| RALGPS1 | ZMAT1 | 0.689358 | 6 | 0 | 6 |
| RALGPS1 | NUB1 | 0.686307 | 3 | 0 | 3 |
| RALGPS1 | NUCB1 | 0.684991 | 3 | 0 | 3 |
| RALGPS1 | GPD1L | 0.684822 | 11 | 0 | 10 |
| RALGPS1 | ZDHHC11 | 0.684782 | 5 | 0 | 5 |
| RALGPS1 | CNKSR3 | 0.672901 | 6 | 0 | 6 |
| RALGPS1 | KAT6B | 0.672477 | 10 | 0 | 9 |
| RALGPS1 | UQCRFS1 | 0.671371 | 3 | 0 | 3 |
| RALGPS1 | USP54 | 0.669772 | 8 | 0 | 8 |
| RALGPS1 | LNX1 | 0.66731 | 7 | 0 | 6 |
For details and further investigation, click here