| Full name: transcription elongation factor A3 | Alias Symbol: TFIIS.H | ||
| Type: protein-coding gene | Cytoband: 1p36.12 | ||
| Entrez ID: 6920 | HGNC ID: HGNC:11615 | Ensembl Gene: ENSG00000204219 | OMIM ID: 604128 |
Expression of TCEA3:
| Dataset | Gene | EntrezID | Probe | Log2FC | Adj.pValue | Expression |
|---|---|---|---|---|---|---|
| GSE17351 | TCEA3 | 6920 | 226388_at | -0.5881 | 0.2357 | |
| GSE26886 | TCEA3 | 6920 | 226388_at | -0.1138 | 0.7781 | |
| GSE45670 | TCEA3 | 6920 | 226388_at | -0.9415 | 0.0058 | |
| GSE53622 | TCEA3 | 6920 | 155624 | -1.1022 | 0.0000 | |
| GSE53624 | TCEA3 | 6920 | 155624 | -1.1624 | 0.0000 | |
| GSE63941 | TCEA3 | 6920 | 226388_at | 0.2269 | 0.9016 | |
| GSE77861 | TCEA3 | 6920 | 226388_at | -1.1646 | 0.0031 | |
| GSE97050 | TCEA3 | 6920 | A_23_P34375 | -0.8556 | 0.1601 | |
| SRP007169 | TCEA3 | 6920 | RNAseq | -0.7258 | 0.2373 | |
| SRP064894 | TCEA3 | 6920 | RNAseq | -0.7131 | 0.0845 | |
| SRP133303 | TCEA3 | 6920 | RNAseq | -1.1697 | 0.0000 | |
| SRP159526 | TCEA3 | 6920 | RNAseq | -0.8400 | 0.0146 | |
| SRP193095 | TCEA3 | 6920 | RNAseq | -0.7807 | 0.0002 | |
| SRP219564 | TCEA3 | 6920 | RNAseq | -0.9971 | 0.0063 | |
| TCGA | TCEA3 | 6920 | RNAseq | -0.6165 | 0.0000 |
Upregulated datasets: 0; Downregulated datasets: 4.
Survival by TCEA3 expression:
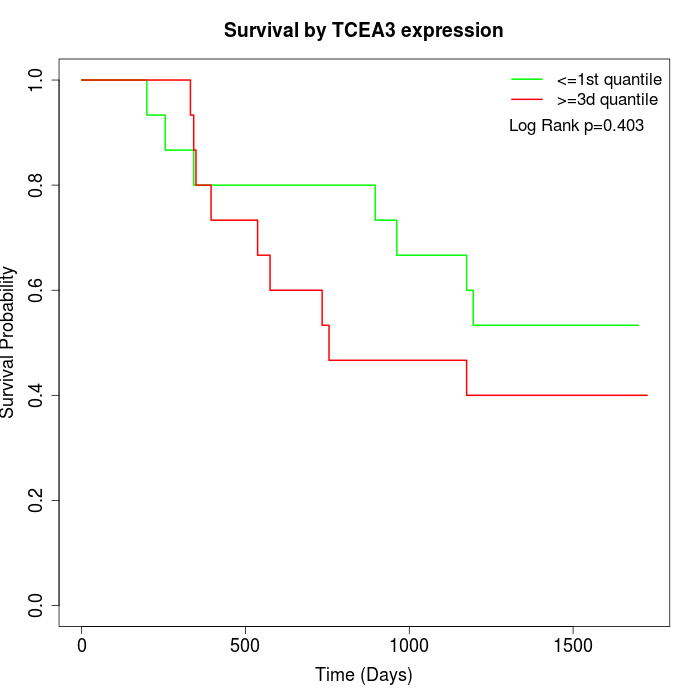 | 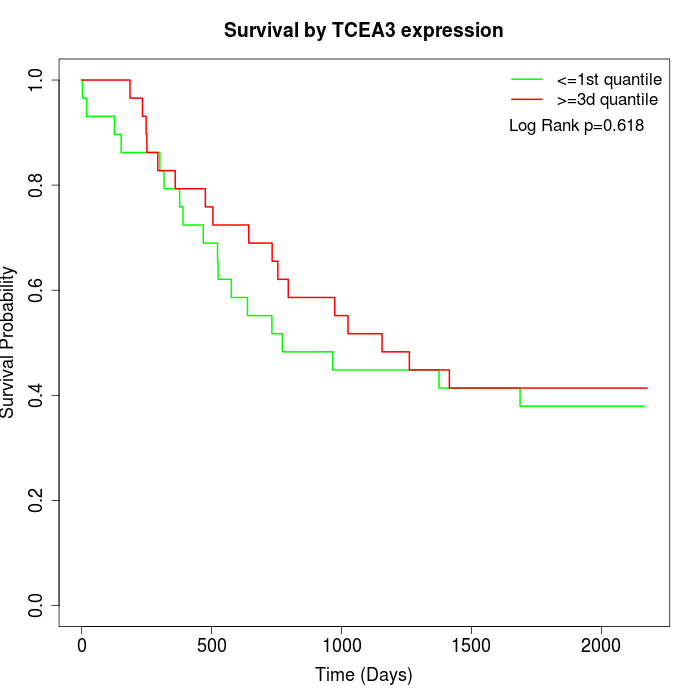 | 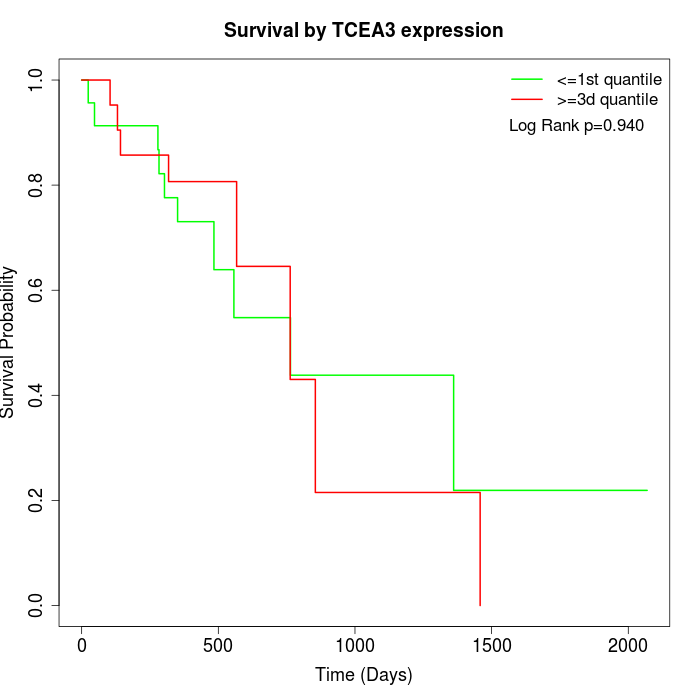 |
| GSE53622 | GSE53624 | TCGA |
Note: Click image to view full size file.
Copy number change of TCEA3:
| Dataset | Gene | EntrezID | Gain | Loss | Normal | Detail |
|---|---|---|---|---|---|---|
| GSE15526 | TCEA3 | 6920 | 0 | 5 | 25 | |
| GSE20123 | TCEA3 | 6920 | 0 | 4 | 26 | |
| GSE43470 | TCEA3 | 6920 | 2 | 6 | 35 | |
| GSE46452 | TCEA3 | 6920 | 5 | 1 | 53 | |
| GSE47630 | TCEA3 | 6920 | 8 | 3 | 29 | |
| GSE54993 | TCEA3 | 6920 | 2 | 1 | 67 | |
| GSE54994 | TCEA3 | 6920 | 11 | 4 | 38 | |
| GSE60625 | TCEA3 | 6920 | 0 | 0 | 11 | |
| GSE74703 | TCEA3 | 6920 | 1 | 4 | 31 | |
| GSE74704 | TCEA3 | 6920 | 0 | 0 | 20 | |
| TCGA | TCEA3 | 6920 | 9 | 23 | 64 |
Total number of gains: 38; Total number of losses: 51; Total Number of normals: 399.
Somatic mutations of TCEA3:
Generating mutation plots.
Highly correlated genes for TCEA3:
Showing top 20/1032 corelated genes with mean PCC>0.5.
| Gene1 | Gene2 | Mean PCC | Num. Datasets | Num. PCC<0 | Num. PCC>0.5 |
|---|---|---|---|---|---|
| TCEA3 | GPD1L | 0.756742 | 7 | 0 | 7 |
| TCEA3 | C6orf89 | 0.754457 | 3 | 0 | 3 |
| TCEA3 | FAM172A | 0.751974 | 6 | 0 | 6 |
| TCEA3 | EFHC2 | 0.750323 | 3 | 0 | 3 |
| TCEA3 | MKRN2 | 0.747181 | 4 | 0 | 4 |
| TCEA3 | PACRGL | 0.742573 | 3 | 0 | 3 |
| TCEA3 | RALGPS1 | 0.739808 | 7 | 0 | 7 |
| TCEA3 | TLE2 | 0.724671 | 4 | 0 | 3 |
| TCEA3 | MPC1 | 0.724001 | 5 | 0 | 5 |
| TCEA3 | RAB5B | 0.718981 | 6 | 0 | 6 |
| TCEA3 | MAGI1 | 0.71221 | 5 | 0 | 5 |
| TCEA3 | PPP1R9A | 0.709035 | 4 | 0 | 4 |
| TCEA3 | SORBS2 | 0.70731 | 6 | 0 | 6 |
| TCEA3 | GALNT12 | 0.707286 | 7 | 0 | 6 |
| TCEA3 | ZNF528 | 0.707035 | 3 | 0 | 3 |
| TCEA3 | SLC25A23 | 0.706932 | 6 | 0 | 5 |
| TCEA3 | ZNF394 | 0.705004 | 3 | 0 | 3 |
| TCEA3 | NFIA | 0.704973 | 6 | 0 | 6 |
| TCEA3 | RAF1 | 0.703374 | 6 | 0 | 6 |
| TCEA3 | ID4 | 0.702882 | 4 | 0 | 4 |
For details and further investigation, click here