| Full name: ribosomal protein S19 | Alias Symbol: DBA|S19|eS19 | ||
| Type: protein-coding gene | Cytoband: 19q13.2 | ||
| Entrez ID: 6223 | HGNC ID: HGNC:10402 | Ensembl Gene: ENSG00000105372 | OMIM ID: 603474 |
| Related drugs: DEXAMETHASONE, RETINOL... [more] | |||
Expression of RPS19:
| Dataset | Gene | EntrezID | Probe | Log2FC | Adj.pValue | Expression |
|---|---|---|---|---|---|---|
| GSE17351 | RPS19 | 6223 | 213414_s_at | 0.1264 | 0.6519 | |
| GSE20347 | RPS19 | 6223 | 213414_s_at | 0.0442 | 0.5669 | |
| GSE23400 | RPS19 | 6223 | 213414_s_at | 0.0688 | 0.3970 | |
| GSE26886 | RPS19 | 6223 | 202649_x_at | 0.0220 | 0.8855 | |
| GSE29001 | RPS19 | 6223 | 202649_x_at | -0.0984 | 0.8163 | |
| GSE38129 | RPS19 | 6223 | 213414_s_at | 0.1895 | 0.0034 | |
| GSE45670 | RPS19 | 6223 | 213414_s_at | -0.0619 | 0.3839 | |
| GSE53622 | RPS19 | 6223 | 78064 | -0.1741 | 0.0088 | |
| GSE53624 | RPS19 | 6223 | 51860 | 0.1347 | 0.0369 | |
| GSE63941 | RPS19 | 6223 | 213414_s_at | 0.1110 | 0.5108 | |
| GSE77861 | RPS19 | 6223 | 213414_s_at | -0.0109 | 0.9595 | |
| GSE97050 | RPS19 | 6223 | A_23_P119130 | 0.1375 | 0.7528 | |
| SRP007169 | RPS19 | 6223 | RNAseq | -1.0601 | 0.0039 | |
| SRP008496 | RPS19 | 6223 | RNAseq | -0.8884 | 0.0003 | |
| SRP064894 | RPS19 | 6223 | RNAseq | 0.2544 | 0.5609 | |
| SRP133303 | RPS19 | 6223 | RNAseq | -0.4414 | 0.0232 | |
| SRP159526 | RPS19 | 6223 | RNAseq | -0.1836 | 0.2801 | |
| SRP193095 | RPS19 | 6223 | RNAseq | -0.7338 | 0.0000 | |
| SRP219564 | RPS19 | 6223 | RNAseq | -0.1931 | 0.5033 | |
| TCGA | RPS19 | 6223 | RNAseq | 0.1481 | 0.0026 |
Upregulated datasets: 0; Downregulated datasets: 1.
Survival by RPS19 expression:
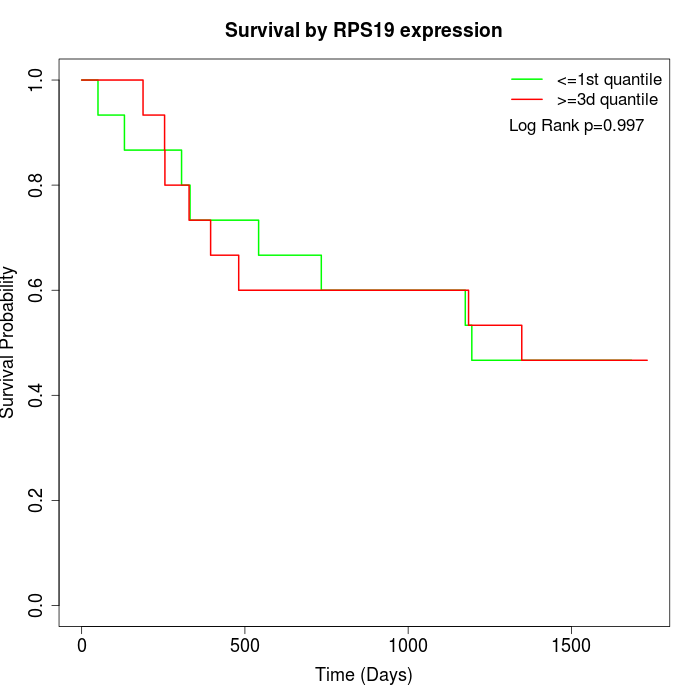 | 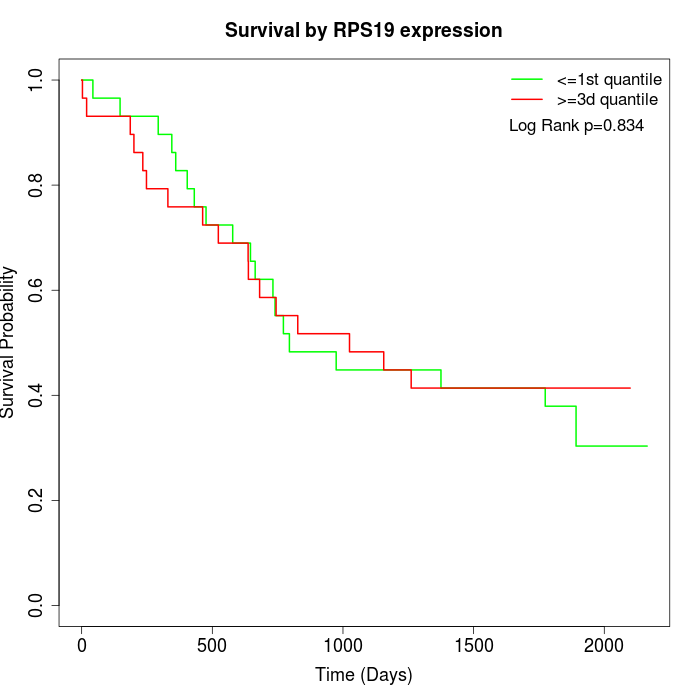 | 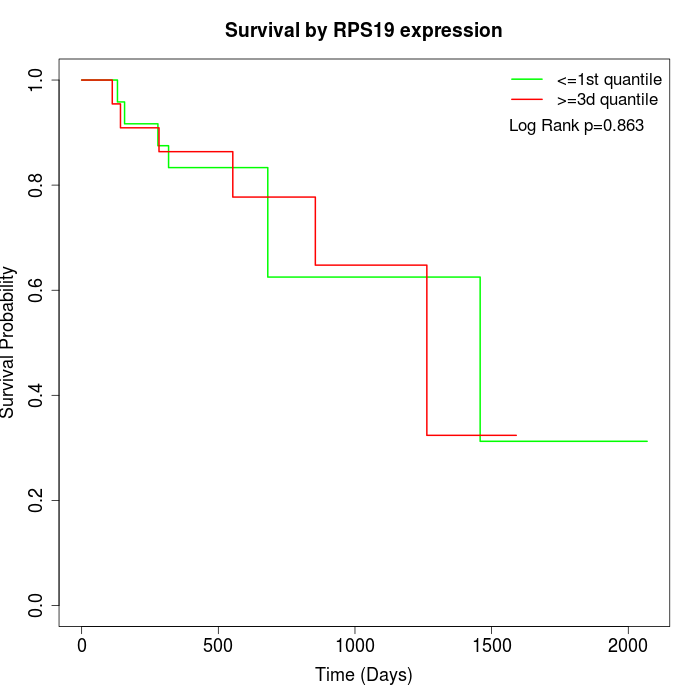 |
| GSE53622 | GSE53624 | TCGA |
Note: Click image to view full size file.
Copy number change of RPS19:
| Dataset | Gene | EntrezID | Gain | Loss | Normal | Detail |
|---|---|---|---|---|---|---|
| GSE15526 | RPS19 | 6223 | 4 | 4 | 22 | |
| GSE20123 | RPS19 | 6223 | 4 | 3 | 23 | |
| GSE43470 | RPS19 | 6223 | 3 | 11 | 29 | |
| GSE46452 | RPS19 | 6223 | 47 | 1 | 11 | |
| GSE47630 | RPS19 | 6223 | 9 | 5 | 26 | |
| GSE54993 | RPS19 | 6223 | 17 | 4 | 49 | |
| GSE54994 | RPS19 | 6223 | 7 | 12 | 34 | |
| GSE60625 | RPS19 | 6223 | 9 | 0 | 2 | |
| GSE74703 | RPS19 | 6223 | 3 | 7 | 26 | |
| GSE74704 | RPS19 | 6223 | 4 | 1 | 15 | |
| TCGA | RPS19 | 6223 | 14 | 15 | 67 |
Total number of gains: 121; Total number of losses: 63; Total Number of normals: 304.
Somatic mutations of RPS19:
Generating mutation plots.
Highly correlated genes for RPS19:
Showing top 20/324 corelated genes with mean PCC>0.5.
| Gene1 | Gene2 | Mean PCC | Num. Datasets | Num. PCC<0 | Num. PCC>0.5 |
|---|---|---|---|---|---|
| RPS19 | ARID1A | 0.758281 | 3 | 0 | 3 |
| RPS19 | WDR25 | 0.744405 | 3 | 0 | 3 |
| RPS19 | FUBP1 | 0.739713 | 3 | 0 | 3 |
| RPS19 | PPP2R5E | 0.739053 | 3 | 0 | 3 |
| RPS19 | NUCB1 | 0.724027 | 3 | 0 | 3 |
| RPS19 | HLA-E | 0.719162 | 3 | 0 | 3 |
| RPS19 | GAPDH | 0.716519 | 3 | 0 | 3 |
| RPS19 | RPL13A | 0.715898 | 3 | 0 | 3 |
| RPS19 | ACP2 | 0.715672 | 3 | 0 | 3 |
| RPS19 | COL17A1 | 0.705815 | 3 | 0 | 3 |
| RPS19 | FAM193A | 0.698976 | 3 | 0 | 3 |
| RPS19 | ACAP1 | 0.698369 | 3 | 0 | 3 |
| RPS19 | KLRC3 | 0.69578 | 3 | 0 | 3 |
| RPS19 | MOV10 | 0.694309 | 3 | 0 | 3 |
| RPS19 | VTI1B | 0.693844 | 3 | 0 | 3 |
| RPS19 | NUDT9 | 0.692928 | 3 | 0 | 3 |
| RPS19 | RPL18A | 0.691884 | 3 | 0 | 3 |
| RPS19 | GATAD2A | 0.684381 | 3 | 0 | 3 |
| RPS19 | RABAC1 | 0.683534 | 4 | 0 | 3 |
| RPS19 | DUSP23 | 0.682518 | 3 | 0 | 3 |
For details and further investigation, click here