| Full name: selenophosphate synthetase 1 | Alias Symbol: SPS|SPS1 | ||
| Type: protein-coding gene | Cytoband: 10p13 | ||
| Entrez ID: 22929 | HGNC ID: HGNC:19685 | Ensembl Gene: ENSG00000086475 | OMIM ID: 600902 |
Screen Evidence:
| |||
Expression of SEPHS1:
| Dataset | Gene | EntrezID | Probe | Log2FC | Adj.pValue | Expression |
|---|---|---|---|---|---|---|
| GSE17351 | SEPHS1 | 22929 | 208939_at | 0.4095 | 0.2516 | |
| GSE20347 | SEPHS1 | 22929 | 208939_at | 0.6256 | 0.0017 | |
| GSE23400 | SEPHS1 | 22929 | 208939_at | 0.5311 | 0.0000 | |
| GSE26886 | SEPHS1 | 22929 | 208939_at | 0.3769 | 0.1063 | |
| GSE29001 | SEPHS1 | 22929 | 208940_at | 0.3390 | 0.4962 | |
| GSE38129 | SEPHS1 | 22929 | 208939_at | 0.5608 | 0.0005 | |
| GSE45670 | SEPHS1 | 22929 | 208939_at | -0.0126 | 0.9638 | |
| GSE53622 | SEPHS1 | 22929 | 64550 | 0.5565 | 0.0000 | |
| GSE53624 | SEPHS1 | 22929 | 64550 | 0.4539 | 0.0000 | |
| GSE63941 | SEPHS1 | 22929 | 208939_at | 0.4505 | 0.2875 | |
| GSE77861 | SEPHS1 | 22929 | 208939_at | 0.0048 | 0.9908 | |
| GSE97050 | SEPHS1 | 22929 | A_23_P150092 | 0.0160 | 0.9541 | |
| SRP007169 | SEPHS1 | 22929 | RNAseq | 0.0924 | 0.7907 | |
| SRP008496 | SEPHS1 | 22929 | RNAseq | 0.3532 | 0.1200 | |
| SRP064894 | SEPHS1 | 22929 | RNAseq | 0.4277 | 0.0267 | |
| SRP133303 | SEPHS1 | 22929 | RNAseq | 0.1490 | 0.2970 | |
| SRP159526 | SEPHS1 | 22929 | RNAseq | 0.3739 | 0.0880 | |
| SRP193095 | SEPHS1 | 22929 | RNAseq | 0.0282 | 0.7752 | |
| SRP219564 | SEPHS1 | 22929 | RNAseq | 0.0449 | 0.8834 | |
| TCGA | SEPHS1 | 22929 | RNAseq | 0.0695 | 0.1915 |
Upregulated datasets: 0; Downregulated datasets: 0.
Survival by SEPHS1 expression:
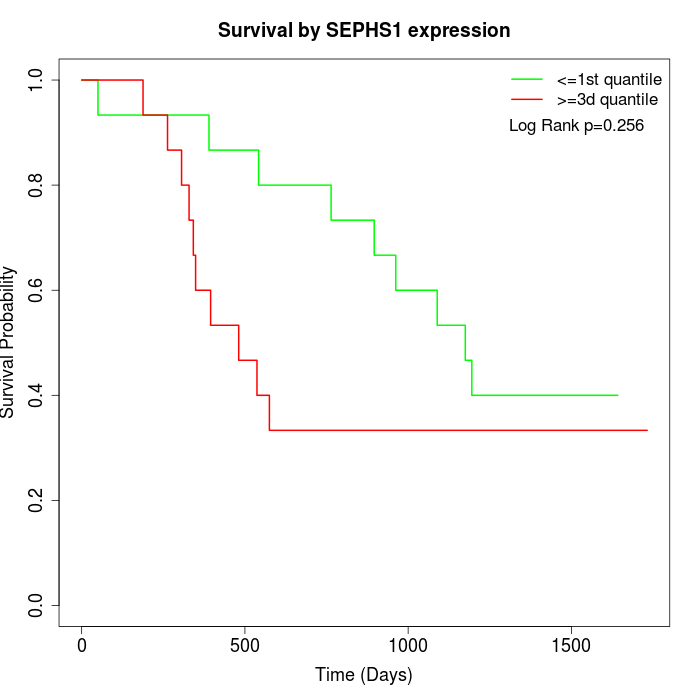 | 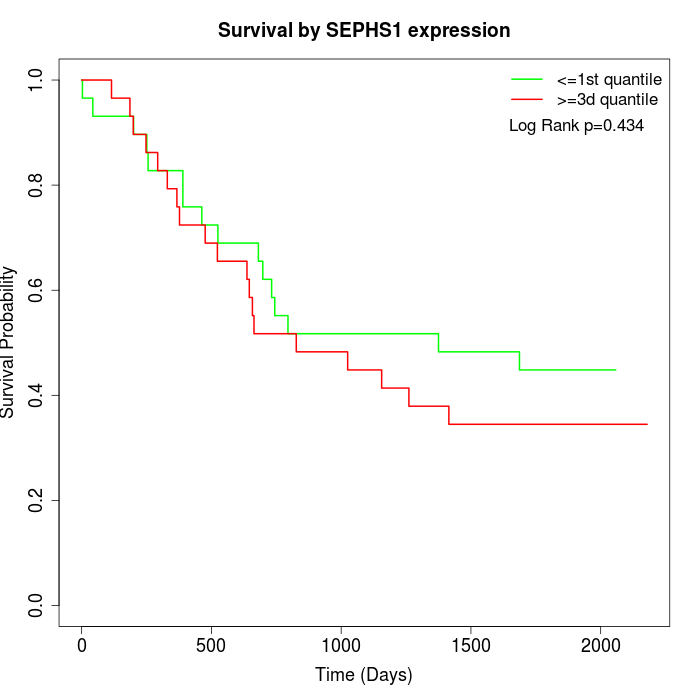 | 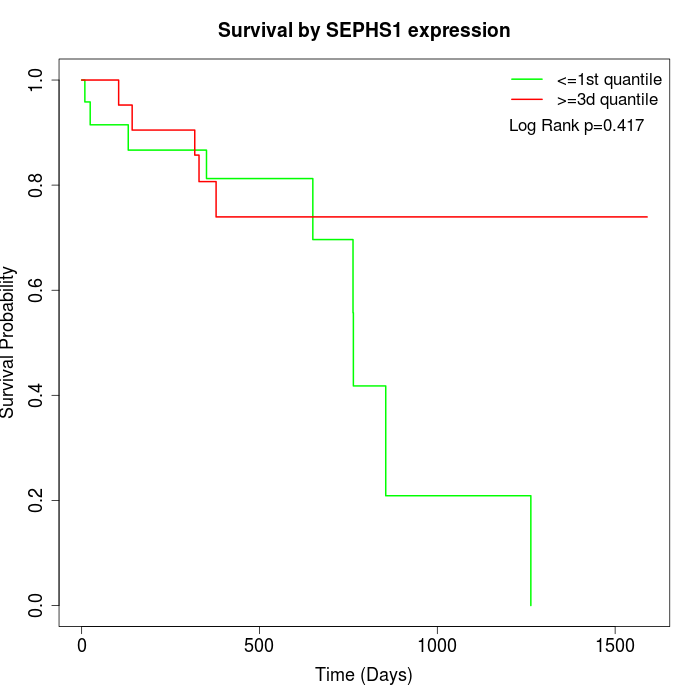 |
| GSE53622 | GSE53624 | TCGA |
Note: Click image to view full size file.
Copy number change of SEPHS1:
| Dataset | Gene | EntrezID | Gain | Loss | Normal | Detail |
|---|---|---|---|---|---|---|
| GSE15526 | SEPHS1 | 22929 | 4 | 8 | 18 | |
| GSE20123 | SEPHS1 | 22929 | 4 | 7 | 19 | |
| GSE43470 | SEPHS1 | 22929 | 3 | 5 | 35 | |
| GSE46452 | SEPHS1 | 22929 | 2 | 14 | 43 | |
| GSE47630 | SEPHS1 | 22929 | 6 | 14 | 20 | |
| GSE54993 | SEPHS1 | 22929 | 11 | 1 | 58 | |
| GSE54994 | SEPHS1 | 22929 | 4 | 9 | 40 | |
| GSE60625 | SEPHS1 | 22929 | 0 | 0 | 11 | |
| GSE74703 | SEPHS1 | 22929 | 2 | 3 | 31 | |
| GSE74704 | SEPHS1 | 22929 | 0 | 6 | 14 | |
| TCGA | SEPHS1 | 22929 | 21 | 24 | 51 |
Total number of gains: 57; Total number of losses: 91; Total Number of normals: 340.
Somatic mutations of SEPHS1:
Generating mutation plots.
Highly correlated genes for SEPHS1:
Showing top 20/880 corelated genes with mean PCC>0.5.
| Gene1 | Gene2 | Mean PCC | Num. Datasets | Num. PCC<0 | Num. PCC>0.5 |
|---|---|---|---|---|---|
| SEPHS1 | LDLRAP1 | 0.748695 | 3 | 0 | 3 |
| SEPHS1 | NCOA5 | 0.746896 | 3 | 0 | 3 |
| SEPHS1 | ZXDA | 0.736484 | 3 | 0 | 3 |
| SEPHS1 | SNRPD3 | 0.735704 | 3 | 0 | 3 |
| SEPHS1 | PIF1 | 0.73211 | 4 | 0 | 4 |
| SEPHS1 | FBXW8 | 0.72229 | 3 | 0 | 3 |
| SEPHS1 | PRPF4B | 0.718327 | 3 | 0 | 3 |
| SEPHS1 | RABL2A | 0.712388 | 3 | 0 | 3 |
| SEPHS1 | SLC25A1 | 0.71024 | 3 | 0 | 3 |
| SEPHS1 | LRRC34 | 0.708007 | 3 | 0 | 3 |
| SEPHS1 | ATP1A1 | 0.7065 | 3 | 0 | 3 |
| SEPHS1 | IFIT5 | 0.695957 | 3 | 0 | 3 |
| SEPHS1 | NEDD1 | 0.69509 | 3 | 0 | 3 |
| SEPHS1 | ZNF644 | 0.687213 | 4 | 0 | 3 |
| SEPHS1 | NAF1 | 0.684934 | 3 | 0 | 3 |
| SEPHS1 | FAM120A | 0.6841 | 4 | 0 | 3 |
| SEPHS1 | PXYLP1 | 0.683702 | 4 | 0 | 3 |
| SEPHS1 | MRPL4 | 0.682946 | 4 | 0 | 3 |
| SEPHS1 | ABL1 | 0.680716 | 3 | 0 | 3 |
| SEPHS1 | FTO | 0.678319 | 3 | 0 | 3 |
For details and further investigation, click here