| Full name: Src homology 2 domain containing E | Alias Symbol: | ||
| Type: protein-coding gene | Cytoband: 1q21.3 | ||
| Entrez ID: 126669 | HGNC ID: HGNC:27004 | Ensembl Gene: ENSG00000169291 | OMIM ID: 610482 |
Expression of SHE:
| Dataset | Gene | EntrezID | Probe | Log2FC | Adj.pValue | Expression |
|---|---|---|---|---|---|---|
| GSE17351 | SHE | 126669 | 229910_at | -0.5310 | 0.3016 | |
| GSE26886 | SHE | 126669 | 229910_at | -0.3744 | 0.1594 | |
| GSE45670 | SHE | 126669 | 229910_at | -1.2692 | 0.0000 | |
| GSE53622 | SHE | 126669 | 114841 | -1.2323 | 0.0000 | |
| GSE53624 | SHE | 126669 | 114841 | -0.9536 | 0.0000 | |
| GSE63941 | SHE | 126669 | 238036_at | 0.2235 | 0.1939 | |
| GSE77861 | SHE | 126669 | 229910_at | -0.0789 | 0.5460 | |
| SRP007169 | SHE | 126669 | RNAseq | 0.1110 | 0.8783 | |
| SRP064894 | SHE | 126669 | RNAseq | 0.0276 | 0.9260 | |
| SRP133303 | SHE | 126669 | RNAseq | -0.9468 | 0.0009 | |
| SRP159526 | SHE | 126669 | RNAseq | 0.0758 | 0.8638 | |
| SRP193095 | SHE | 126669 | RNAseq | -0.2202 | 0.1566 | |
| SRP219564 | SHE | 126669 | RNAseq | 0.3946 | 0.4683 | |
| TCGA | SHE | 126669 | RNAseq | -0.7420 | 0.0000 |
Upregulated datasets: 0; Downregulated datasets: 2.
Survival by SHE expression:
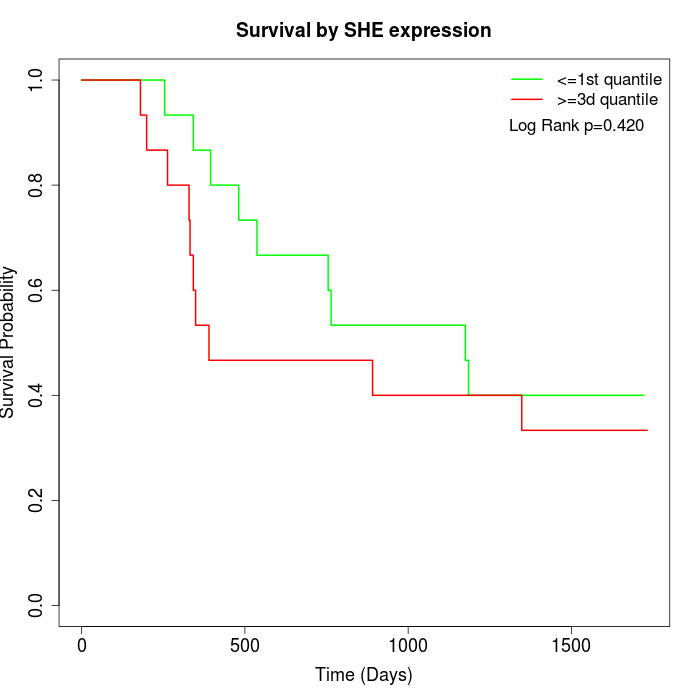 | 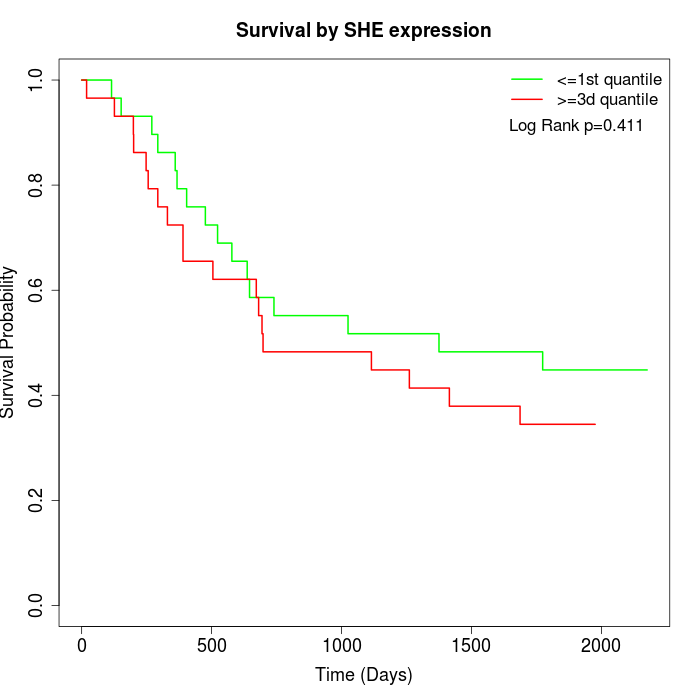 | 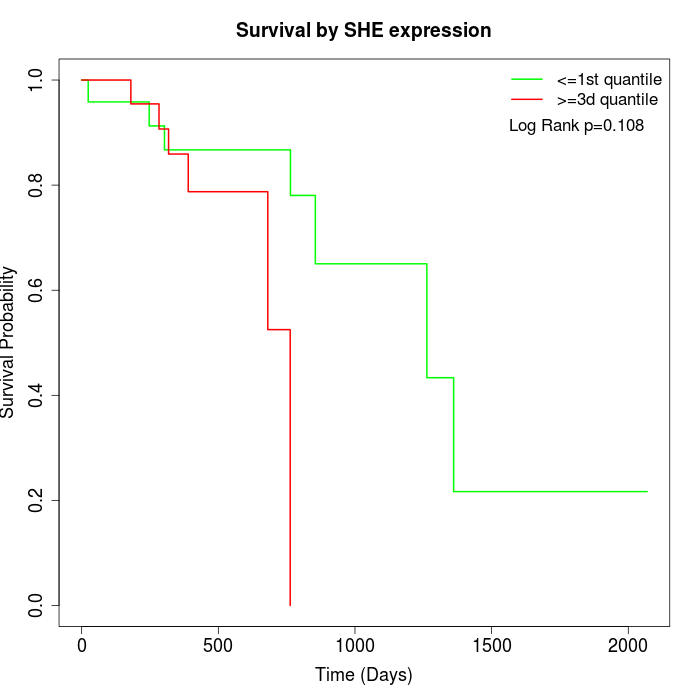 |
| GSE53622 | GSE53624 | TCGA |
Note: Click image to view full size file.
Copy number change of SHE:
| Dataset | Gene | EntrezID | Gain | Loss | Normal | Detail |
|---|---|---|---|---|---|---|
| GSE15526 | SHE | 126669 | 15 | 0 | 15 | |
| GSE20123 | SHE | 126669 | 14 | 0 | 16 | |
| GSE43470 | SHE | 126669 | 6 | 2 | 35 | |
| GSE46452 | SHE | 126669 | 2 | 1 | 56 | |
| GSE47630 | SHE | 126669 | 14 | 0 | 26 | |
| GSE54993 | SHE | 126669 | 0 | 4 | 66 | |
| GSE54994 | SHE | 126669 | 16 | 0 | 37 | |
| GSE60625 | SHE | 126669 | 0 | 0 | 11 | |
| GSE74703 | SHE | 126669 | 6 | 1 | 29 | |
| GSE74704 | SHE | 126669 | 7 | 0 | 13 | |
| TCGA | SHE | 126669 | 38 | 2 | 56 |
Total number of gains: 118; Total number of losses: 10; Total Number of normals: 360.
Somatic mutations of SHE:
Generating mutation plots.
Highly correlated genes for SHE:
Showing top 20/432 corelated genes with mean PCC>0.5.
| Gene1 | Gene2 | Mean PCC | Num. Datasets | Num. PCC<0 | Num. PCC>0.5 |
|---|---|---|---|---|---|
| SHE | KL | 0.773944 | 3 | 0 | 3 |
| SHE | C1QTNF2 | 0.770771 | 3 | 0 | 3 |
| SHE | MMRN1 | 0.769149 | 5 | 0 | 5 |
| SHE | LRRN4CL | 0.742825 | 4 | 0 | 4 |
| SHE | ITM2A | 0.727409 | 5 | 0 | 4 |
| SHE | GIMAP6 | 0.724706 | 5 | 0 | 5 |
| SHE | PTPRB | 0.717261 | 5 | 0 | 4 |
| SHE | ACKR1 | 0.715408 | 5 | 0 | 5 |
| SHE | CYBRD1 | 0.713969 | 3 | 0 | 3 |
| SHE | FZD4 | 0.710018 | 4 | 0 | 4 |
| SHE | TFPI | 0.705921 | 5 | 0 | 4 |
| SHE | ECSCR | 0.701096 | 5 | 0 | 5 |
| SHE | ADH1B | 0.695242 | 5 | 0 | 5 |
| SHE | ABI3BP | 0.692424 | 5 | 0 | 5 |
| SHE | TMEM100 | 0.690982 | 5 | 0 | 5 |
| SHE | P2RY14 | 0.687632 | 5 | 0 | 5 |
| SHE | FLI1 | 0.687572 | 6 | 0 | 6 |
| SHE | RERGL | 0.685381 | 4 | 0 | 4 |
| SHE | PDE1A | 0.683671 | 4 | 0 | 3 |
| SHE | LIFR | 0.683482 | 4 | 0 | 4 |
For details and further investigation, click here