| Full name: protein tyrosine phosphatase receptor type B | Alias Symbol: | ||
| Type: protein-coding gene | Cytoband: 12q15 | ||
| Entrez ID: 5787 | HGNC ID: HGNC:9665 | Ensembl Gene: ENSG00000127329 | OMIM ID: 176882 |
| Related drugs: SUNITINIB... [more] | |||
PTPRB involved pathways:
| KEGG pathway | Description | View |
|---|---|---|
| hsa04520 | Adherens junction |
Expression of PTPRB:
| Dataset | Gene | EntrezID | Probe | Log2FC | Adj.pValue | Expression |
|---|---|---|---|---|---|---|
| GSE17351 | PTPRB | 5787 | 230250_at | -0.8269 | 0.1717 | |
| GSE20347 | PTPRB | 5787 | 205846_at | -0.0859 | 0.3005 | |
| GSE23400 | PTPRB | 5787 | 205846_at | -0.1274 | 0.0002 | |
| GSE26886 | PTPRB | 5787 | 230250_at | 0.3758 | 0.2627 | |
| GSE29001 | PTPRB | 5787 | 217177_s_at | -0.1355 | 0.3488 | |
| GSE38129 | PTPRB | 5787 | 205846_at | -0.1525 | 0.0760 | |
| GSE45670 | PTPRB | 5787 | 230250_at | -1.4272 | 0.0007 | |
| GSE53622 | PTPRB | 5787 | 51590 | -0.9348 | 0.0000 | |
| GSE53624 | PTPRB | 5787 | 51590 | -0.5463 | 0.0000 | |
| GSE63941 | PTPRB | 5787 | 205846_at | 0.6453 | 0.0394 | |
| GSE77861 | PTPRB | 5787 | 205846_at | 0.0154 | 0.8820 | |
| GSE97050 | PTPRB | 5787 | A_23_P53390 | -0.0961 | 0.7564 | |
| SRP007169 | PTPRB | 5787 | RNAseq | 1.1417 | 0.0015 | |
| SRP008496 | PTPRB | 5787 | RNAseq | 1.6010 | 0.0000 | |
| SRP064894 | PTPRB | 5787 | RNAseq | 0.1764 | 0.6257 | |
| SRP133303 | PTPRB | 5787 | RNAseq | -0.7622 | 0.0023 | |
| SRP159526 | PTPRB | 5787 | RNAseq | -0.3858 | 0.3269 | |
| SRP193095 | PTPRB | 5787 | RNAseq | 0.1463 | 0.5767 | |
| SRP219564 | PTPRB | 5787 | RNAseq | -0.2090 | 0.6801 | |
| TCGA | PTPRB | 5787 | RNAseq | -0.6891 | 0.0000 |
Upregulated datasets: 2; Downregulated datasets: 1.
Survival by PTPRB expression:
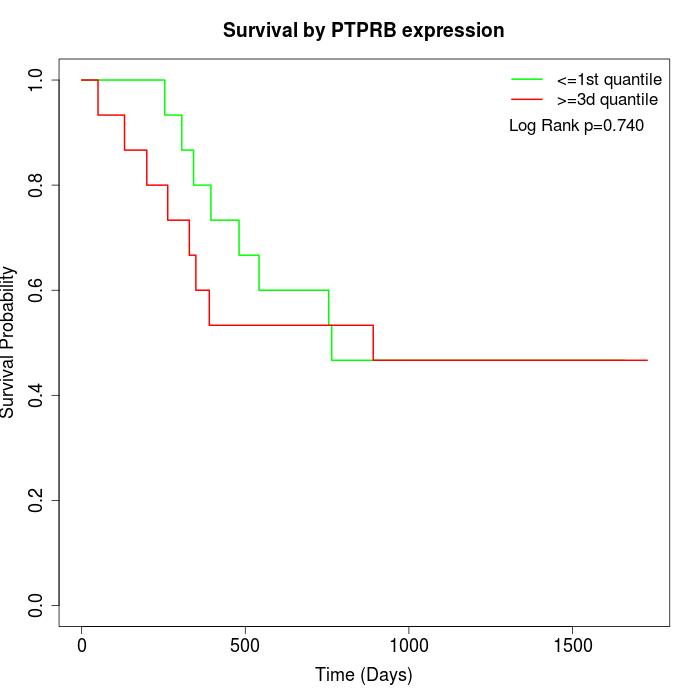 | 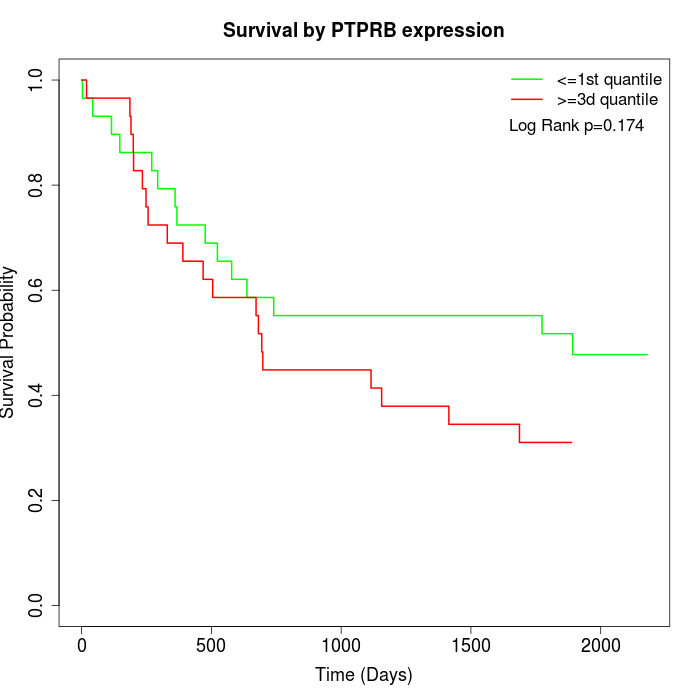 | 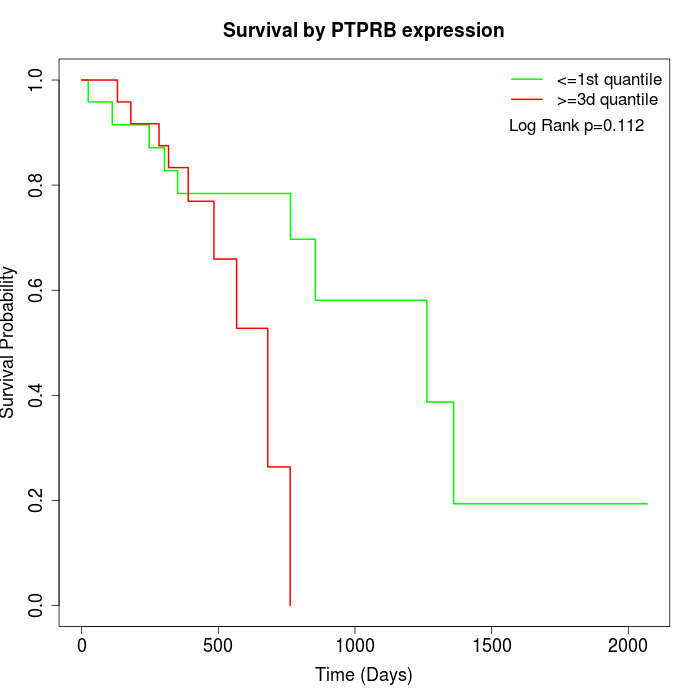 |
| GSE53622 | GSE53624 | TCGA |
Note: Click image to view full size file.
Copy number change of PTPRB:
| Dataset | Gene | EntrezID | Gain | Loss | Normal | Detail |
|---|---|---|---|---|---|---|
| GSE15526 | PTPRB | 5787 | 6 | 0 | 24 | |
| GSE20123 | PTPRB | 5787 | 6 | 0 | 24 | |
| GSE43470 | PTPRB | 5787 | 4 | 0 | 39 | |
| GSE46452 | PTPRB | 5787 | 9 | 1 | 49 | |
| GSE47630 | PTPRB | 5787 | 10 | 1 | 29 | |
| GSE54993 | PTPRB | 5787 | 0 | 5 | 65 | |
| GSE54994 | PTPRB | 5787 | 8 | 1 | 44 | |
| GSE60625 | PTPRB | 5787 | 0 | 0 | 11 | |
| GSE74703 | PTPRB | 5787 | 4 | 0 | 32 | |
| GSE74704 | PTPRB | 5787 | 5 | 0 | 15 | |
| TCGA | PTPRB | 5787 | 22 | 8 | 66 |
Total number of gains: 74; Total number of losses: 16; Total Number of normals: 398.
Somatic mutations of PTPRB:
Generating mutation plots.
Highly correlated genes for PTPRB:
Showing top 20/612 corelated genes with mean PCC>0.5.
| Gene1 | Gene2 | Mean PCC | Num. Datasets | Num. PCC<0 | Num. PCC>0.5 |
|---|---|---|---|---|---|
| PTPRB | ECSCR | 0.872924 | 5 | 0 | 5 |
| PTPRB | GIMAP5 | 0.817838 | 3 | 0 | 3 |
| PTPRB | BHLHE22 | 0.777962 | 5 | 0 | 5 |
| PTPRB | RHOT1 | 0.774885 | 3 | 0 | 3 |
| PTPRB | CLEC3B | 0.765977 | 3 | 0 | 3 |
| PTPRB | CGNL1 | 0.764755 | 3 | 0 | 3 |
| PTPRB | TMEM219 | 0.761564 | 3 | 0 | 3 |
| PTPRB | ARHGAP31 | 0.759776 | 5 | 0 | 5 |
| PTPRB | CCDC80 | 0.757711 | 6 | 0 | 6 |
| PTPRB | LRFN5 | 0.754938 | 4 | 0 | 4 |
| PTPRB | RHOJ | 0.754211 | 5 | 0 | 4 |
| PTPRB | TCEAL6 | 0.753167 | 3 | 0 | 3 |
| PTPRB | C1QTNF7 | 0.752982 | 5 | 0 | 5 |
| PTPRB | KAT7 | 0.751731 | 3 | 0 | 3 |
| PTPRB | TFPI | 0.746111 | 8 | 0 | 7 |
| PTPRB | CYYR1 | 0.744344 | 6 | 0 | 5 |
| PTPRB | TPP1 | 0.743385 | 3 | 0 | 3 |
| PTPRB | C3orf70 | 0.741761 | 6 | 0 | 6 |
| PTPRB | MIER1 | 0.737217 | 3 | 0 | 3 |
| PTPRB | SLITRK6 | 0.736747 | 3 | 0 | 3 |
For details and further investigation, click here