| Full name: solute carrier organic anion transporter family member 1B1 | Alias Symbol: OATP-C|LST-1|OATP1B1 | ||
| Type: protein-coding gene | Cytoband: 12p12.1 | ||
| Entrez ID: 10599 | HGNC ID: HGNC:10959 | Ensembl Gene: ENSG00000134538 | OMIM ID: 604843 |
| Related drugs: ATORVASTATIN, CLOFIBRATE, CYCLOSPORINE, DOCETAXEL, FENOFIBRATE, GEMFIBROZIL, GLYCYRRHIZIN, METHOTREXATE, PRAVASTATIN, RIFAMPICIN... [more] | |||
SLCO1B1 involved pathways:
| KEGG pathway | Description | View |
|---|---|---|
| hsa04976 | Bile secretion |
Expression of SLCO1B1:
| Dataset | Gene | EntrezID | Probe | Log2FC | Adj.pValue | Expression |
|---|---|---|---|---|---|---|
| GSE17351 | SLCO1B1 | 10599 | 210366_at | 0.1509 | 0.5914 | |
| GSE20347 | SLCO1B1 | 10599 | 210366_at | 0.1275 | 0.0149 | |
| GSE23400 | SLCO1B1 | 10599 | 210366_at | 0.0284 | 0.1942 | |
| GSE26886 | SLCO1B1 | 10599 | 210366_at | 0.0659 | 0.6555 | |
| GSE29001 | SLCO1B1 | 10599 | 210366_at | 0.3090 | 0.0512 | |
| GSE38129 | SLCO1B1 | 10599 | 210366_at | 0.1590 | 0.2514 | |
| GSE45670 | SLCO1B1 | 10599 | 210366_at | 0.4035 | 0.0148 | |
| GSE63941 | SLCO1B1 | 10599 | 210366_at | 0.2677 | 0.5472 | |
| GSE77861 | SLCO1B1 | 10599 | 210366_at | -0.0051 | 0.9687 | |
| TCGA | SLCO1B1 | 10599 | RNAseq | 5.5090 | 0.0000 |
Upregulated datasets: 1; Downregulated datasets: 0.
Survival by SLCO1B1 expression:
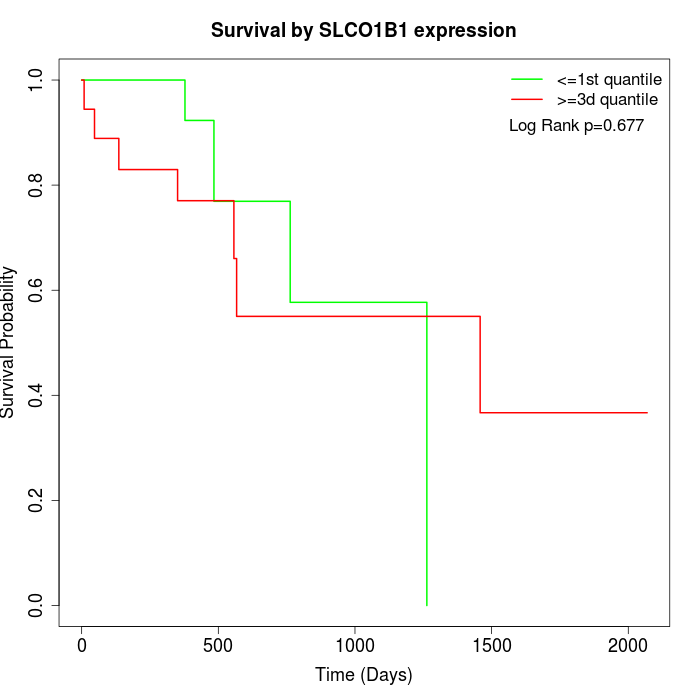 |
| TCGA |
Note: Click image to view full size file.
Copy number change of SLCO1B1:
| Dataset | Gene | EntrezID | Gain | Loss | Normal | Detail |
|---|---|---|---|---|---|---|
| GSE15526 | SLCO1B1 | 10599 | 9 | 2 | 19 | |
| GSE20123 | SLCO1B1 | 10599 | 9 | 2 | 19 | |
| GSE43470 | SLCO1B1 | 10599 | 9 | 4 | 30 | |
| GSE46452 | SLCO1B1 | 10599 | 10 | 1 | 48 | |
| GSE47630 | SLCO1B1 | 10599 | 14 | 1 | 25 | |
| GSE54993 | SLCO1B1 | 10599 | 1 | 9 | 60 | |
| GSE54994 | SLCO1B1 | 10599 | 11 | 2 | 40 | |
| GSE60625 | SLCO1B1 | 10599 | 0 | 1 | 10 | |
| GSE74703 | SLCO1B1 | 10599 | 9 | 3 | 24 | |
| GSE74704 | SLCO1B1 | 10599 | 6 | 1 | 13 | |
| TCGA | SLCO1B1 | 10599 | 42 | 5 | 49 |
Total number of gains: 120; Total number of losses: 31; Total Number of normals: 337.
Somatic mutations of SLCO1B1:
Generating mutation plots.
Highly correlated genes for SLCO1B1:
Showing top 20/80 corelated genes with mean PCC>0.5.
| Gene1 | Gene2 | Mean PCC | Num. Datasets | Num. PCC<0 | Num. PCC>0.5 |
|---|---|---|---|---|---|
| SLCO1B1 | SIX2 | 0.727762 | 3 | 0 | 3 |
| SLCO1B1 | TKTL1 | 0.703763 | 3 | 0 | 3 |
| SLCO1B1 | LINC01128 | 0.701531 | 3 | 0 | 3 |
| SLCO1B1 | RAD23A | 0.69152 | 3 | 0 | 3 |
| SLCO1B1 | UBE2O | 0.660056 | 4 | 0 | 3 |
| SLCO1B1 | MAGEA10 | 0.651932 | 4 | 0 | 4 |
| SLCO1B1 | ZNF526 | 0.65168 | 3 | 0 | 3 |
| SLCO1B1 | SPTB | 0.65113 | 3 | 0 | 3 |
| SLCO1B1 | MAZ | 0.649408 | 3 | 0 | 3 |
| SLCO1B1 | ESCO1 | 0.647623 | 3 | 0 | 3 |
| SLCO1B1 | SLC9A7 | 0.636587 | 3 | 0 | 3 |
| SLCO1B1 | FAM189B | 0.627518 | 4 | 0 | 3 |
| SLCO1B1 | CHD4 | 0.617754 | 3 | 0 | 3 |
| SLCO1B1 | TMEM161A | 0.617307 | 3 | 0 | 3 |
| SLCO1B1 | CDC34 | 0.617265 | 4 | 0 | 3 |
| SLCO1B1 | LSM4 | 0.613277 | 3 | 0 | 3 |
| SLCO1B1 | RNASEH2A | 0.610483 | 3 | 0 | 3 |
| SLCO1B1 | LZIC | 0.601441 | 3 | 0 | 3 |
| SLCO1B1 | MAPKAPK2 | 0.595523 | 3 | 0 | 3 |
| SLCO1B1 | PHKG2 | 0.594832 | 3 | 0 | 3 |
For details and further investigation, click here