| Full name: stathmin 2 | Alias Symbol: SCG10 | ||
| Type: protein-coding gene | Cytoband: 8q21.13 | ||
| Entrez ID: 11075 | HGNC ID: HGNC:10577 | Ensembl Gene: ENSG00000104435 | OMIM ID: 600621 |
Expression of STMN2:
| Dataset | Gene | EntrezID | Probe | Log2FC | Adj.pValue | Expression |
|---|---|---|---|---|---|---|
| GSE17351 | STMN2 | 11075 | 203000_at | -0.3379 | 0.7658 | |
| GSE20347 | STMN2 | 11075 | 203000_at | 0.0829 | 0.3623 | |
| GSE23400 | STMN2 | 11075 | 203000_at | -0.2193 | 0.0000 | |
| GSE26886 | STMN2 | 11075 | 203000_at | -0.0208 | 0.8932 | |
| GSE29001 | STMN2 | 11075 | 203000_at | -0.1472 | 0.3341 | |
| GSE38129 | STMN2 | 11075 | 203000_at | -0.1903 | 0.5674 | |
| GSE45670 | STMN2 | 11075 | 203000_at | -0.0600 | 0.5314 | |
| GSE53622 | STMN2 | 11075 | 133147 | 0.1616 | 0.6341 | |
| GSE53624 | STMN2 | 11075 | 133147 | 1.0962 | 0.0000 | |
| GSE63941 | STMN2 | 11075 | 203000_at | -0.0528 | 0.7630 | |
| GSE77861 | STMN2 | 11075 | 203000_at | -0.1870 | 0.0421 | |
| GSE97050 | STMN2 | 11075 | A_23_P146274 | -0.3395 | 0.4150 | |
| TCGA | STMN2 | 11075 | RNAseq | -2.4631 | 0.0003 |
Upregulated datasets: 1; Downregulated datasets: 1.
Survival by STMN2 expression:
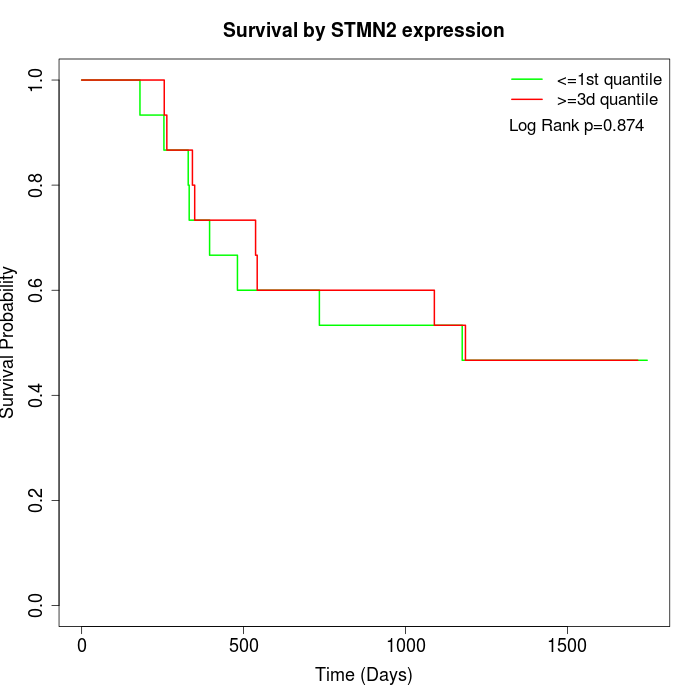 |  |  |
| GSE53622 | GSE53624 | TCGA |
Note: Click image to view full size file.
Copy number change of STMN2:
| Dataset | Gene | EntrezID | Gain | Loss | Normal | Detail |
|---|---|---|---|---|---|---|
| GSE15526 | STMN2 | 11075 | 16 | 1 | 13 | |
| GSE20123 | STMN2 | 11075 | 18 | 1 | 11 | |
| GSE43470 | STMN2 | 11075 | 18 | 1 | 24 | |
| GSE46452 | STMN2 | 11075 | 21 | 0 | 38 | |
| GSE47630 | STMN2 | 11075 | 23 | 0 | 17 | |
| GSE54993 | STMN2 | 11075 | 0 | 19 | 51 | |
| GSE54994 | STMN2 | 11075 | 30 | 0 | 23 | |
| GSE60625 | STMN2 | 11075 | 0 | 4 | 7 | |
| GSE74703 | STMN2 | 11075 | 15 | 1 | 20 | |
| GSE74704 | STMN2 | 11075 | 12 | 0 | 8 | |
| TCGA | STMN2 | 11075 | 50 | 3 | 43 |
Total number of gains: 203; Total number of losses: 30; Total Number of normals: 255.
Somatic mutations of STMN2:
Generating mutation plots.
Highly correlated genes for STMN2:
Showing top 20/550 corelated genes with mean PCC>0.5.
| Gene1 | Gene2 | Mean PCC | Num. Datasets | Num. PCC<0 | Num. PCC>0.5 |
|---|---|---|---|---|---|
| STMN2 | CACNA1H | 0.760604 | 5 | 0 | 5 |
| STMN2 | SOX3 | 0.742072 | 3 | 0 | 3 |
| STMN2 | NPY | 0.732317 | 9 | 0 | 8 |
| STMN2 | PWAR5 | 0.72502 | 3 | 0 | 3 |
| STMN2 | ADRB3 | 0.694571 | 4 | 0 | 3 |
| STMN2 | TENM1 | 0.688874 | 4 | 0 | 3 |
| STMN2 | SYT4 | 0.684301 | 4 | 0 | 3 |
| STMN2 | HABP4 | 0.683401 | 5 | 0 | 5 |
| STMN2 | NECAB1 | 0.675895 | 3 | 0 | 3 |
| STMN2 | SH3GL2 | 0.674911 | 7 | 0 | 6 |
| STMN2 | DACT3 | 0.672027 | 4 | 0 | 4 |
| STMN2 | PLEKHB1 | 0.671552 | 5 | 0 | 4 |
| STMN2 | PNLIP | 0.669921 | 3 | 0 | 3 |
| STMN2 | MTFR1L | 0.668146 | 3 | 0 | 3 |
| STMN2 | TAC3 | 0.664043 | 4 | 0 | 4 |
| STMN2 | VIP | 0.661457 | 10 | 0 | 9 |
| STMN2 | SP7 | 0.659576 | 3 | 0 | 3 |
| STMN2 | RNF167 | 0.65848 | 3 | 0 | 3 |
| STMN2 | NACAD | 0.657503 | 7 | 0 | 7 |
| STMN2 | NRK | 0.656973 | 5 | 0 | 4 |
For details and further investigation, click here