| Full name: N-terminal EF-hand calcium binding protein 1 | Alias Symbol: | ||
| Type: protein-coding gene | Cytoband: 8q21.3 | ||
| Entrez ID: 64168 | HGNC ID: HGNC:20983 | Ensembl Gene: ENSG00000123119 | OMIM ID: |
Expression of NECAB1:
| Dataset | Gene | EntrezID | Probe | Log2FC | Adj.pValue | Expression |
|---|---|---|---|---|---|---|
| GSE17351 | NECAB1 | 64168 | 233305_at | -0.1114 | 0.8188 | |
| GSE26886 | NECAB1 | 64168 | 233305_at | 0.1033 | 0.1694 | |
| GSE45670 | NECAB1 | 64168 | 233305_at | -0.0959 | 0.2662 | |
| GSE53622 | NECAB1 | 64168 | 31710 | -0.6670 | 0.0023 | |
| GSE53624 | NECAB1 | 64168 | 31710 | -0.9130 | 0.0000 | |
| GSE63941 | NECAB1 | 64168 | 233305_at | -0.0494 | 0.7239 | |
| GSE77861 | NECAB1 | 64168 | 233305_at | -0.0157 | 0.8650 | |
| SRP064894 | NECAB1 | 64168 | RNAseq | -0.1007 | 0.7781 | |
| SRP133303 | NECAB1 | 64168 | RNAseq | -0.9742 | 0.0001 | |
| SRP159526 | NECAB1 | 64168 | RNAseq | -0.4520 | 0.4660 | |
| SRP193095 | NECAB1 | 64168 | RNAseq | 0.1213 | 0.6140 | |
| SRP219564 | NECAB1 | 64168 | RNAseq | -0.2063 | 0.8193 | |
| TCGA | NECAB1 | 64168 | RNAseq | -0.8754 | 0.0010 |
Upregulated datasets: 0; Downregulated datasets: 0.
Survival by NECAB1 expression:
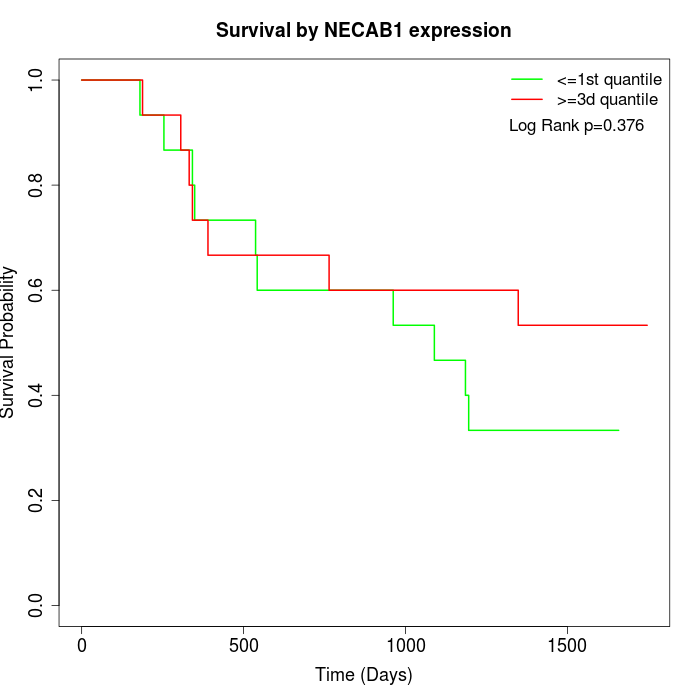 | 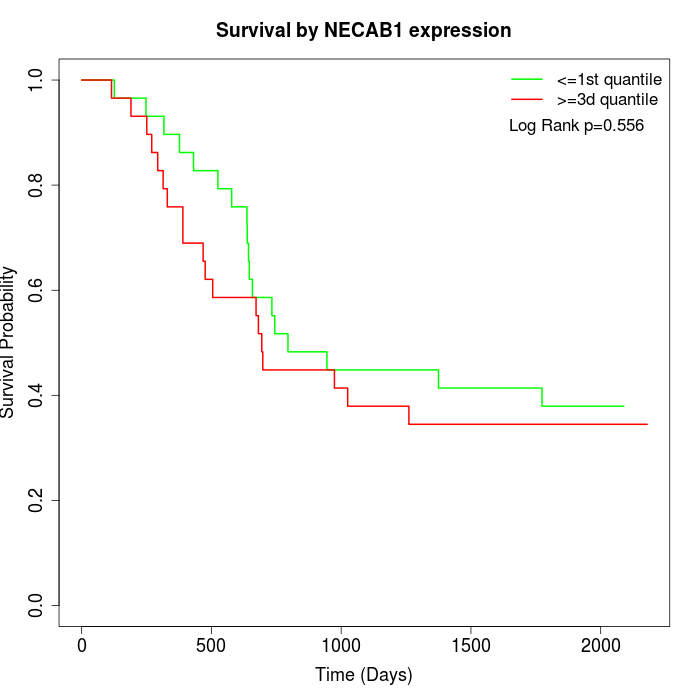 | 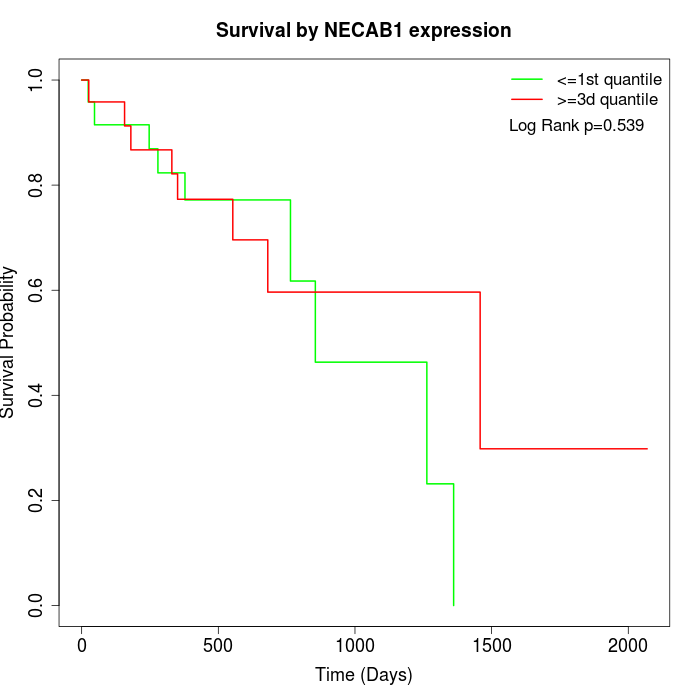 |
| GSE53622 | GSE53624 | TCGA |
Note: Click image to view full size file.
Copy number change of NECAB1:
| Dataset | Gene | EntrezID | Gain | Loss | Normal | Detail |
|---|---|---|---|---|---|---|
| GSE15526 | NECAB1 | 64168 | 14 | 1 | 15 | |
| GSE20123 | NECAB1 | 64168 | 15 | 1 | 14 | |
| GSE43470 | NECAB1 | 64168 | 20 | 1 | 22 | |
| GSE46452 | NECAB1 | 64168 | 22 | 0 | 37 | |
| GSE47630 | NECAB1 | 64168 | 24 | 0 | 16 | |
| GSE54993 | NECAB1 | 64168 | 0 | 20 | 50 | |
| GSE54994 | NECAB1 | 64168 | 33 | 1 | 19 | |
| GSE60625 | NECAB1 | 64168 | 0 | 4 | 7 | |
| GSE74703 | NECAB1 | 64168 | 17 | 1 | 18 | |
| GSE74704 | NECAB1 | 64168 | 10 | 0 | 10 | |
| TCGA | NECAB1 | 64168 | 56 | 1 | 39 |
Total number of gains: 211; Total number of losses: 30; Total Number of normals: 247.
Somatic mutations of NECAB1:
Generating mutation plots.
Highly correlated genes for NECAB1:
Showing top 20/89 corelated genes with mean PCC>0.5.
| Gene1 | Gene2 | Mean PCC | Num. Datasets | Num. PCC<0 | Num. PCC>0.5 |
|---|---|---|---|---|---|
| NECAB1 | GPM6A | 0.836024 | 3 | 0 | 3 |
| NECAB1 | WSCD2 | 0.760994 | 3 | 0 | 3 |
| NECAB1 | CDHR3 | 0.732679 | 3 | 0 | 3 |
| NECAB1 | SMPX | 0.730872 | 4 | 0 | 3 |
| NECAB1 | LINC00702 | 0.70982 | 3 | 0 | 3 |
| NECAB1 | C9orf47 | 0.706278 | 3 | 0 | 3 |
| NECAB1 | LRCH2 | 0.676582 | 3 | 0 | 3 |
| NECAB1 | STMN2 | 0.675895 | 3 | 0 | 3 |
| NECAB1 | GADL1 | 0.663425 | 4 | 0 | 3 |
| NECAB1 | POPDC2 | 0.648566 | 4 | 0 | 3 |
| NECAB1 | FRMD3 | 0.645104 | 3 | 0 | 3 |
| NECAB1 | HTR2B | 0.642306 | 4 | 0 | 3 |
| NECAB1 | MYOT | 0.6419 | 4 | 0 | 3 |
| NECAB1 | HECTD2 | 0.636979 | 4 | 0 | 3 |
| NECAB1 | IQUB | 0.634589 | 4 | 0 | 3 |
| NECAB1 | HAND2-AS1 | 0.634551 | 4 | 0 | 3 |
| NECAB1 | KIF5C | 0.63443 | 3 | 0 | 3 |
| NECAB1 | TTLL7 | 0.630635 | 3 | 0 | 3 |
| NECAB1 | ADAMTSL3 | 0.62557 | 4 | 0 | 3 |
| NECAB1 | RBPMS2 | 0.623336 | 3 | 0 | 3 |
For details and further investigation, click here