| Full name: storkhead box 1 | Alias Symbol: FLJ25162 | ||
| Type: protein-coding gene | Cytoband: 10q22.1 | ||
| Entrez ID: 219736 | HGNC ID: HGNC:23508 | Ensembl Gene: ENSG00000165730 | OMIM ID: 609397 |
Expression of STOX1:
| Dataset | Gene | EntrezID | Probe | Log2FC | Adj.pValue | Expression |
|---|---|---|---|---|---|---|
| GSE17351 | STOX1 | 219736 | 229378_at | -0.0911 | 0.9348 | |
| GSE26886 | STOX1 | 219736 | 229378_at | 1.1943 | 0.0048 | |
| GSE45670 | STOX1 | 219736 | 229378_at | -0.2243 | 0.5566 | |
| GSE53622 | STOX1 | 219736 | 126467 | -0.6284 | 0.0025 | |
| GSE53624 | STOX1 | 219736 | 126467 | -0.1872 | 0.3325 | |
| GSE63941 | STOX1 | 219736 | 229378_at | 1.5087 | 0.0512 | |
| GSE77861 | STOX1 | 219736 | 229378_at | 0.1148 | 0.4833 | |
| GSE97050 | STOX1 | 219736 | A_23_P344481 | -0.6835 | 0.2705 | |
| SRP064894 | STOX1 | 219736 | RNAseq | -0.9425 | 0.0065 | |
| SRP133303 | STOX1 | 219736 | RNAseq | -0.0522 | 0.9177 | |
| SRP159526 | STOX1 | 219736 | RNAseq | 1.2855 | 0.0043 | |
| SRP219564 | STOX1 | 219736 | RNAseq | -0.0970 | 0.9043 | |
| TCGA | STOX1 | 219736 | RNAseq | -0.3278 | 0.2231 |
Upregulated datasets: 2; Downregulated datasets: 0.
Survival by STOX1 expression:
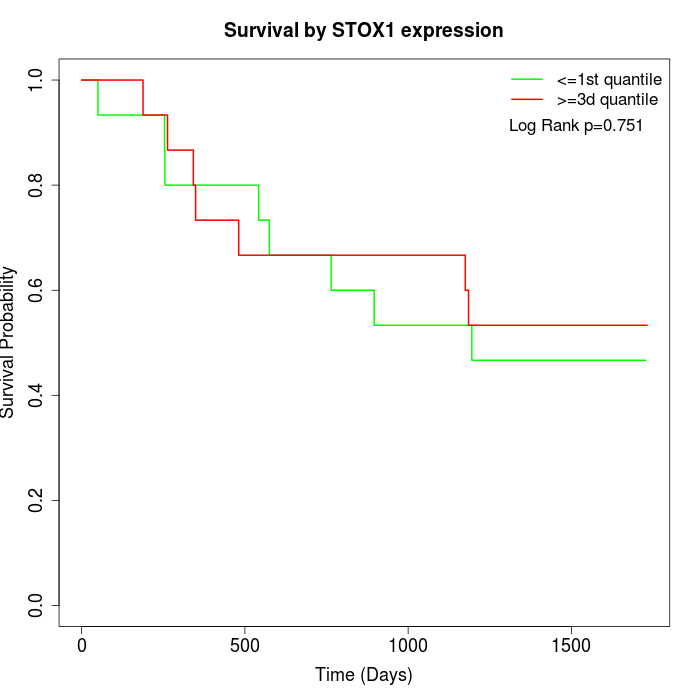 | 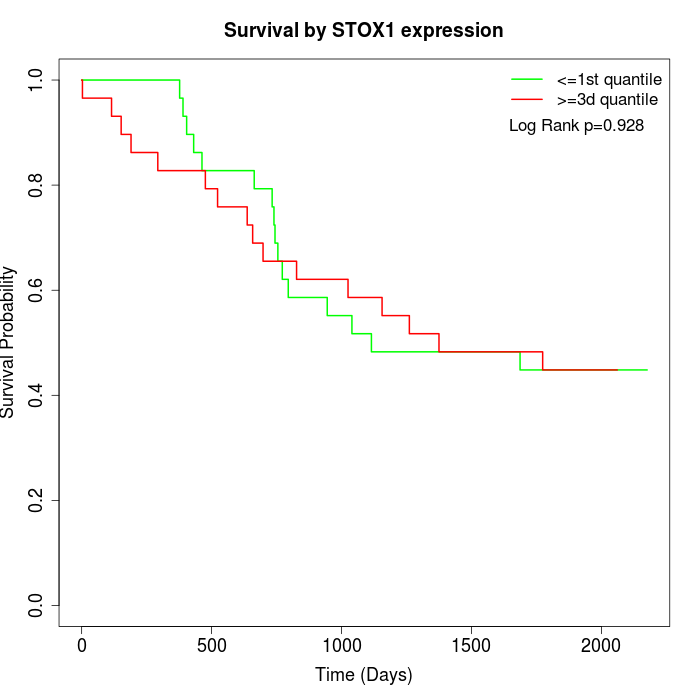 | 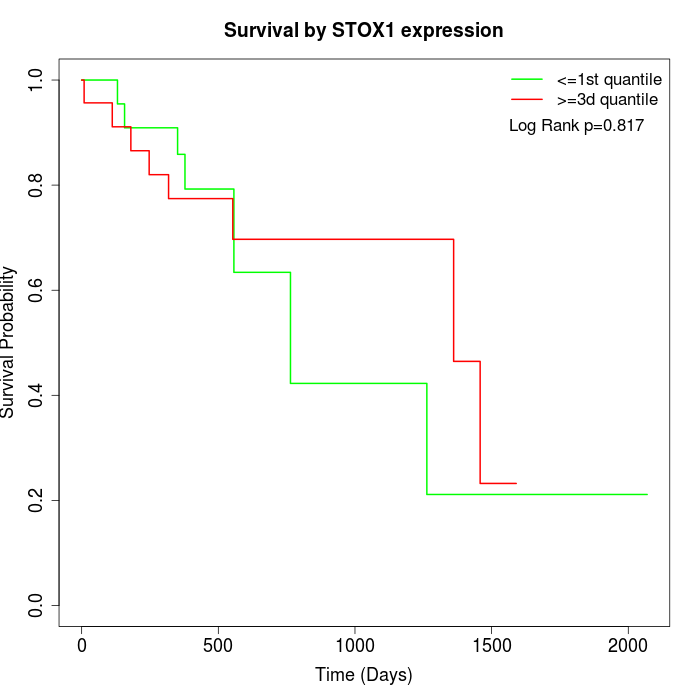 |
| GSE53622 | GSE53624 | TCGA |
Note: Click image to view full size file.
Copy number change of STOX1:
| Dataset | Gene | EntrezID | Gain | Loss | Normal | Detail |
|---|---|---|---|---|---|---|
| GSE15526 | STOX1 | 219736 | 3 | 4 | 23 | |
| GSE20123 | STOX1 | 219736 | 3 | 3 | 24 | |
| GSE43470 | STOX1 | 219736 | 1 | 8 | 34 | |
| GSE46452 | STOX1 | 219736 | 0 | 11 | 48 | |
| GSE47630 | STOX1 | 219736 | 2 | 14 | 24 | |
| GSE54993 | STOX1 | 219736 | 8 | 0 | 62 | |
| GSE54994 | STOX1 | 219736 | 2 | 12 | 39 | |
| GSE60625 | STOX1 | 219736 | 0 | 0 | 11 | |
| GSE74703 | STOX1 | 219736 | 1 | 5 | 30 | |
| GSE74704 | STOX1 | 219736 | 1 | 1 | 18 | |
| TCGA | STOX1 | 219736 | 10 | 22 | 64 |
Total number of gains: 31; Total number of losses: 80; Total Number of normals: 377.
Somatic mutations of STOX1:
Generating mutation plots.
Highly correlated genes for STOX1:
Showing top 20/135 corelated genes with mean PCC>0.5.
| Gene1 | Gene2 | Mean PCC | Num. Datasets | Num. PCC<0 | Num. PCC>0.5 |
|---|---|---|---|---|---|
| STOX1 | TMEM200C | 0.730339 | 3 | 0 | 3 |
| STOX1 | ZNF581 | 0.690226 | 3 | 0 | 3 |
| STOX1 | DHRSX | 0.674542 | 3 | 0 | 3 |
| STOX1 | ZNF384 | 0.674381 | 3 | 0 | 3 |
| STOX1 | ZIC2 | 0.669788 | 3 | 0 | 3 |
| STOX1 | LSM4 | 0.664811 | 3 | 0 | 3 |
| STOX1 | SLC17A7 | 0.659606 | 3 | 0 | 3 |
| STOX1 | CA11 | 0.656168 | 4 | 0 | 3 |
| STOX1 | IL27RA | 0.653232 | 3 | 0 | 3 |
| STOX1 | UNC119 | 0.651748 | 3 | 0 | 3 |
| STOX1 | UGGT2 | 0.646937 | 3 | 0 | 3 |
| STOX1 | RPS6KA6 | 0.643432 | 4 | 0 | 3 |
| STOX1 | RFXAP | 0.640458 | 3 | 0 | 3 |
| STOX1 | ATP2A3 | 0.638738 | 4 | 0 | 3 |
| STOX1 | TRAF3IP2-AS1 | 0.637585 | 3 | 0 | 3 |
| STOX1 | KCNE3 | 0.629227 | 3 | 0 | 3 |
| STOX1 | WASIR1 | 0.626313 | 3 | 0 | 3 |
| STOX1 | ORAI1 | 0.626264 | 3 | 0 | 3 |
| STOX1 | GABRR1 | 0.622711 | 4 | 0 | 3 |
| STOX1 | UQCRB | 0.622692 | 3 | 0 | 3 |
For details and further investigation, click here