| Full name: transforming growth factor beta receptor associated protein 1 | Alias Symbol: TRAP-1|TRAP1|VPS3 | ||
| Type: protein-coding gene | Cytoband: 2q12.1-q12.2 | ||
| Entrez ID: 9392 | HGNC ID: HGNC:16836 | Ensembl Gene: ENSG00000135966 | OMIM ID: 606237 |
Screen Evidence:
| |||
Expression of TGFBRAP1:
| Dataset | Gene | EntrezID | Probe | Log2FC | Adj.pValue | Expression |
|---|---|---|---|---|---|---|
| GSE17351 | TGFBRAP1 | 9392 | 221235_s_at | 0.3947 | 0.1659 | |
| GSE20347 | TGFBRAP1 | 9392 | 221235_s_at | 0.0577 | 0.5819 | |
| GSE23400 | TGFBRAP1 | 9392 | 221235_s_at | 0.0242 | 0.6058 | |
| GSE26886 | TGFBRAP1 | 9392 | 221235_s_at | 0.3984 | 0.1883 | |
| GSE29001 | TGFBRAP1 | 9392 | 221235_s_at | 0.0923 | 0.6738 | |
| GSE38129 | TGFBRAP1 | 9392 | 221235_s_at | 0.0811 | 0.4711 | |
| GSE45670 | TGFBRAP1 | 9392 | 221235_s_at | -0.1459 | 0.2634 | |
| GSE53622 | TGFBRAP1 | 9392 | 18700 | 0.1514 | 0.0034 | |
| GSE53624 | TGFBRAP1 | 9392 | 18700 | 0.1948 | 0.0001 | |
| GSE63941 | TGFBRAP1 | 9392 | 221235_s_at | -0.2288 | 0.5476 | |
| GSE77861 | TGFBRAP1 | 9392 | 225653_at | -0.0093 | 0.9489 | |
| GSE97050 | TGFBRAP1 | 9392 | A_23_P120146 | 0.0229 | 0.9340 | |
| SRP007169 | TGFBRAP1 | 9392 | RNAseq | 0.0442 | 0.8910 | |
| SRP008496 | TGFBRAP1 | 9392 | RNAseq | 0.3678 | 0.2014 | |
| SRP064894 | TGFBRAP1 | 9392 | RNAseq | 0.1554 | 0.1828 | |
| SRP133303 | TGFBRAP1 | 9392 | RNAseq | 0.1069 | 0.3080 | |
| SRP159526 | TGFBRAP1 | 9392 | RNAseq | 0.1359 | 0.4189 | |
| SRP193095 | TGFBRAP1 | 9392 | RNAseq | 0.2352 | 0.0602 | |
| SRP219564 | TGFBRAP1 | 9392 | RNAseq | -0.0651 | 0.7900 | |
| TCGA | TGFBRAP1 | 9392 | RNAseq | -0.2559 | 0.0000 |
Upregulated datasets: 0; Downregulated datasets: 0.
Survival by TGFBRAP1 expression:
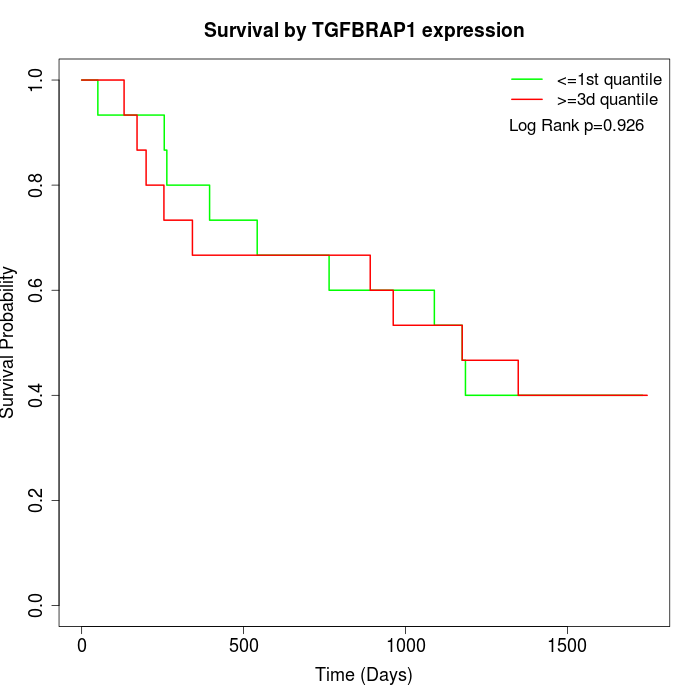 | 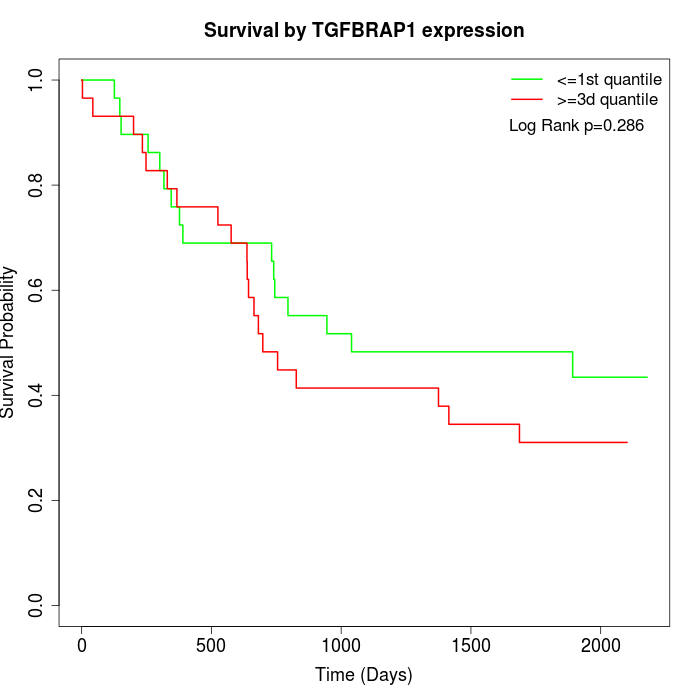 | 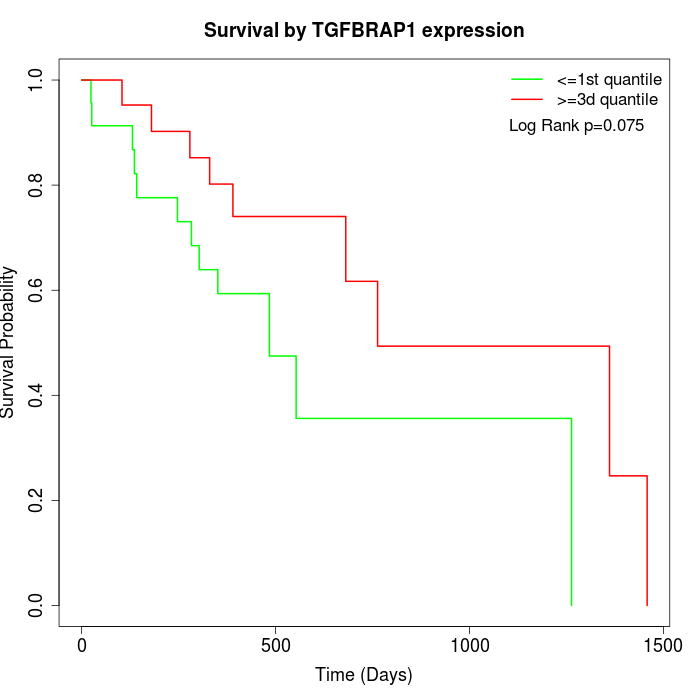 |
| GSE53622 | GSE53624 | TCGA |
Note: Click image to view full size file.
Copy number change of TGFBRAP1:
| Dataset | Gene | EntrezID | Gain | Loss | Normal | Detail |
|---|---|---|---|---|---|---|
| GSE15526 | TGFBRAP1 | 9392 | 3 | 2 | 25 | |
| GSE20123 | TGFBRAP1 | 9392 | 3 | 2 | 25 | |
| GSE43470 | TGFBRAP1 | 9392 | 3 | 1 | 39 | |
| GSE46452 | TGFBRAP1 | 9392 | 1 | 4 | 54 | |
| GSE47630 | TGFBRAP1 | 9392 | 7 | 0 | 33 | |
| GSE54993 | TGFBRAP1 | 9392 | 0 | 6 | 64 | |
| GSE54994 | TGFBRAP1 | 9392 | 10 | 0 | 43 | |
| GSE60625 | TGFBRAP1 | 9392 | 0 | 3 | 8 | |
| GSE74703 | TGFBRAP1 | 9392 | 3 | 1 | 32 | |
| GSE74704 | TGFBRAP1 | 9392 | 2 | 2 | 16 | |
| TCGA | TGFBRAP1 | 9392 | 34 | 5 | 57 |
Total number of gains: 66; Total number of losses: 26; Total Number of normals: 396.
Somatic mutations of TGFBRAP1:
Generating mutation plots.
Highly correlated genes for TGFBRAP1:
Showing top 20/359 corelated genes with mean PCC>0.5.
| Gene1 | Gene2 | Mean PCC | Num. Datasets | Num. PCC<0 | Num. PCC>0.5 |
|---|---|---|---|---|---|
| TGFBRAP1 | SSBP4 | 0.806955 | 3 | 0 | 3 |
| TGFBRAP1 | GOLGA3 | 0.786376 | 3 | 0 | 3 |
| TGFBRAP1 | POGK | 0.781139 | 3 | 0 | 3 |
| TGFBRAP1 | CCDC14 | 0.768256 | 3 | 0 | 3 |
| TGFBRAP1 | NLK | 0.765264 | 3 | 0 | 3 |
| TGFBRAP1 | MTMR4 | 0.764858 | 3 | 0 | 3 |
| TGFBRAP1 | POLR3C | 0.757486 | 4 | 0 | 4 |
| TGFBRAP1 | UHMK1 | 0.755559 | 3 | 0 | 3 |
| TGFBRAP1 | ZNF567 | 0.752355 | 3 | 0 | 3 |
| TGFBRAP1 | CHML | 0.747292 | 3 | 0 | 3 |
| TGFBRAP1 | TMEM201 | 0.736254 | 3 | 0 | 3 |
| TGFBRAP1 | BTG1 | 0.732284 | 3 | 0 | 3 |
| TGFBRAP1 | CSPP1 | 0.731065 | 3 | 0 | 3 |
| TGFBRAP1 | HPS3 | 0.726834 | 3 | 0 | 3 |
| TGFBRAP1 | PRRC2C | 0.725624 | 3 | 0 | 3 |
| TGFBRAP1 | ULK1 | 0.723018 | 3 | 0 | 3 |
| TGFBRAP1 | NTPCR | 0.722247 | 3 | 0 | 3 |
| TGFBRAP1 | ZNF260 | 0.719884 | 4 | 0 | 3 |
| TGFBRAP1 | ZNF740 | 0.716315 | 3 | 0 | 3 |
| TGFBRAP1 | ZNF641 | 0.713034 | 3 | 0 | 3 |
For details and further investigation, click here