| Full name: TLE family member 3, transcriptional corepressor | Alias Symbol: ESG|ESG3|KIAA1547|HsT18976|GRG3 | ||
| Type: protein-coding gene | Cytoband: 15q23 | ||
| Entrez ID: 7090 | HGNC ID: HGNC:11839 | Ensembl Gene: ENSG00000140332 | OMIM ID: 600190 |
| Related drugs: DOCETAXEL, PACLITAXEL... [more] | |||
Expression of TLE3:
| Dataset | Gene | EntrezID | Probe | Log2FC | Adj.pValue | Expression |
|---|---|---|---|---|---|---|
| GSE17351 | TLE3 | 7090 | 212770_at | 0.1682 | 0.6138 | |
| GSE20347 | TLE3 | 7090 | 212770_at | -0.2668 | 0.0898 | |
| GSE23400 | TLE3 | 7090 | 212770_at | -0.1211 | 0.0360 | |
| GSE26886 | TLE3 | 7090 | 228340_at | -0.5902 | 0.0028 | |
| GSE29001 | TLE3 | 7090 | 212770_at | -0.2300 | 0.3966 | |
| GSE38129 | TLE3 | 7090 | 212770_at | -0.1121 | 0.4232 | |
| GSE45670 | TLE3 | 7090 | 212770_at | 0.0949 | 0.5311 | |
| GSE53622 | TLE3 | 7090 | 100208 | -0.4083 | 0.0000 | |
| GSE53624 | TLE3 | 7090 | 100208 | -0.4929 | 0.0000 | |
| GSE63941 | TLE3 | 7090 | 212770_at | 1.3868 | 0.0002 | |
| GSE77861 | TLE3 | 7090 | 212769_at | -0.5826 | 0.0506 | |
| GSE97050 | TLE3 | 7090 | A_23_P342934 | -0.0443 | 0.8502 | |
| SRP007169 | TLE3 | 7090 | RNAseq | -0.3876 | 0.4303 | |
| SRP008496 | TLE3 | 7090 | RNAseq | -0.3564 | 0.2654 | |
| SRP064894 | TLE3 | 7090 | RNAseq | -0.2359 | 0.2399 | |
| SRP133303 | TLE3 | 7090 | RNAseq | -0.1708 | 0.3857 | |
| SRP159526 | TLE3 | 7090 | RNAseq | -0.0462 | 0.8204 | |
| SRP193095 | TLE3 | 7090 | RNAseq | -0.2168 | 0.1753 | |
| SRP219564 | TLE3 | 7090 | RNAseq | -0.3081 | 0.2428 | |
| TCGA | TLE3 | 7090 | RNAseq | 0.0486 | 0.3318 |
Upregulated datasets: 1; Downregulated datasets: 0.
Survival by TLE3 expression:
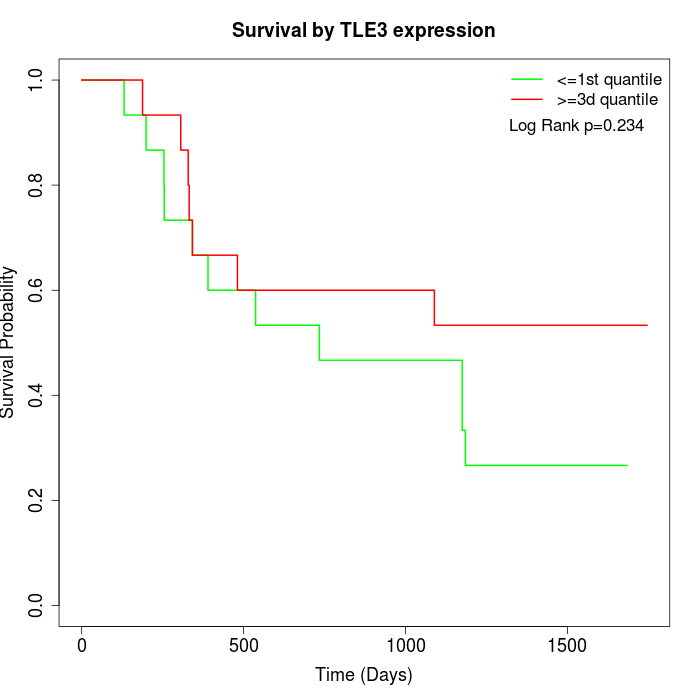 | 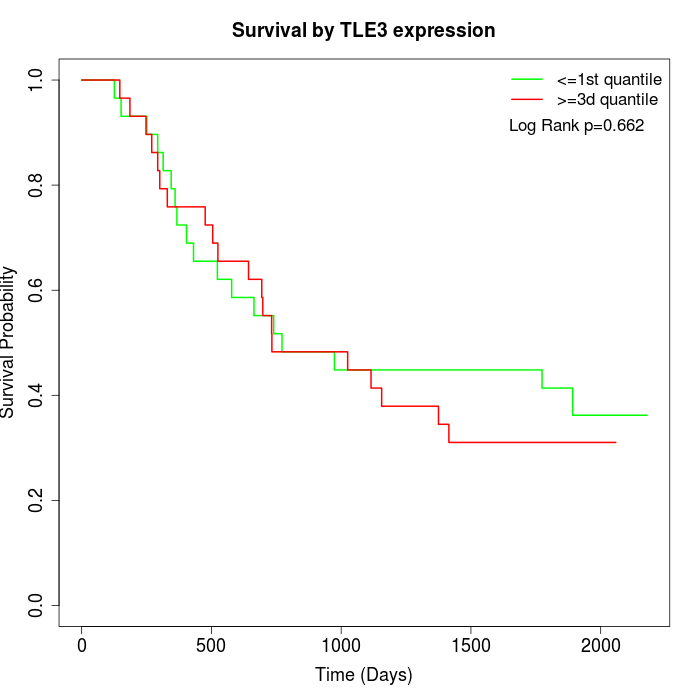 | 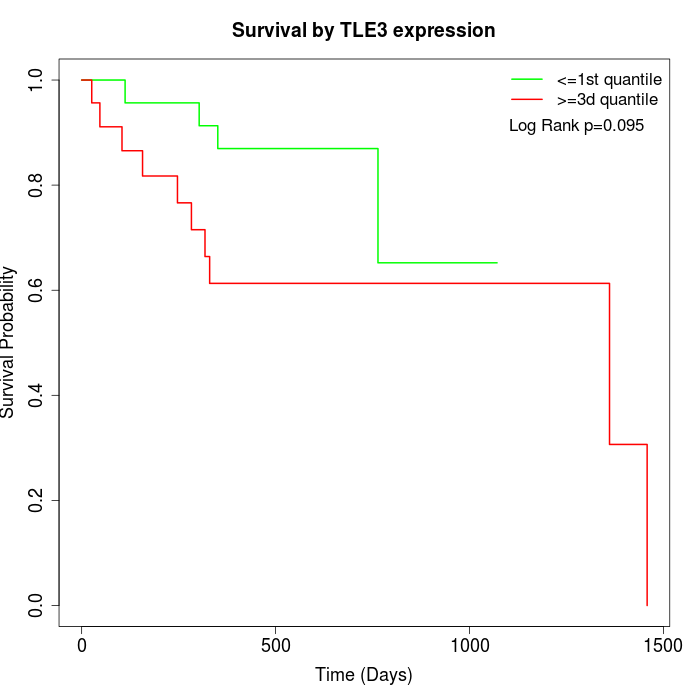 |
| GSE53622 | GSE53624 | TCGA |
Note: Click image to view full size file.
Copy number change of TLE3:
| Dataset | Gene | EntrezID | Gain | Loss | Normal | Detail |
|---|---|---|---|---|---|---|
| GSE15526 | TLE3 | 7090 | 7 | 1 | 22 | |
| GSE20123 | TLE3 | 7090 | 7 | 1 | 22 | |
| GSE43470 | TLE3 | 7090 | 4 | 6 | 33 | |
| GSE46452 | TLE3 | 7090 | 3 | 7 | 49 | |
| GSE47630 | TLE3 | 7090 | 8 | 10 | 22 | |
| GSE54993 | TLE3 | 7090 | 5 | 6 | 59 | |
| GSE54994 | TLE3 | 7090 | 5 | 8 | 40 | |
| GSE60625 | TLE3 | 7090 | 4 | 4 | 3 | |
| GSE74703 | TLE3 | 7090 | 4 | 3 | 29 | |
| GSE74704 | TLE3 | 7090 | 3 | 1 | 16 | |
| TCGA | TLE3 | 7090 | 11 | 15 | 70 |
Total number of gains: 61; Total number of losses: 62; Total Number of normals: 365.
Somatic mutations of TLE3:
Generating mutation plots.
Highly correlated genes for TLE3:
Showing top 20/250 corelated genes with mean PCC>0.5.
| Gene1 | Gene2 | Mean PCC | Num. Datasets | Num. PCC<0 | Num. PCC>0.5 |
|---|---|---|---|---|---|
| TLE3 | LGALS9 | 0.677651 | 3 | 0 | 3 |
| TLE3 | CHMP4C | 0.67495 | 3 | 0 | 3 |
| TLE3 | TMBIM6 | 0.647958 | 4 | 0 | 3 |
| TLE3 | SGPL1 | 0.642563 | 8 | 0 | 7 |
| TLE3 | CDK16 | 0.625067 | 3 | 0 | 3 |
| TLE3 | PRR15L | 0.61399 | 4 | 0 | 3 |
| TLE3 | TINCR | 0.612945 | 4 | 0 | 4 |
| TLE3 | UBAC2 | 0.6112 | 5 | 0 | 5 |
| TLE3 | CLINT1 | 0.61072 | 5 | 0 | 3 |
| TLE3 | PLEKHA7 | 0.61066 | 6 | 0 | 4 |
| TLE3 | PAQR8 | 0.610431 | 4 | 0 | 4 |
| TLE3 | MARS2 | 0.608833 | 3 | 0 | 3 |
| TLE3 | CSNK1G1 | 0.608034 | 5 | 0 | 4 |
| TLE3 | ZNRF2 | 0.607221 | 3 | 0 | 3 |
| TLE3 | LAMTOR2 | 0.605471 | 3 | 0 | 3 |
| TLE3 | P2RY1 | 0.60119 | 4 | 0 | 3 |
| TLE3 | DMKN | 0.60083 | 4 | 0 | 3 |
| TLE3 | HOXA-AS2 | 0.597588 | 3 | 0 | 3 |
| TLE3 | UBTF | 0.596571 | 6 | 0 | 5 |
| TLE3 | RCAN3 | 0.595534 | 4 | 0 | 4 |
For details and further investigation, click here