| Full name: transmembrane BAX inhibitor motif containing 4 | Alias Symbol: CGI-119|S1R|ZPRO|LFG4|GAAP | ||
| Type: protein-coding gene | Cytoband: 12q14.3 | ||
| Entrez ID: 51643 | HGNC ID: HGNC:24257 | Ensembl Gene: ENSG00000155957 | OMIM ID: 616874 |
Expression of TMBIM4:
| Dataset | Gene | EntrezID | Probe | Log2FC | Adj.pValue | Expression |
|---|---|---|---|---|---|---|
| GSE17351 | TMBIM4 | 51643 | 223892_s_at | -0.3196 | 0.3225 | |
| GSE20347 | TMBIM4 | 51643 | 219206_x_at | -0.4620 | 0.0011 | |
| GSE23400 | TMBIM4 | 51643 | 219206_x_at | -0.1024 | 0.0660 | |
| GSE26886 | TMBIM4 | 51643 | 222845_x_at | -0.7536 | 0.0000 | |
| GSE29001 | TMBIM4 | 51643 | 219206_x_at | 0.0058 | 0.9770 | |
| GSE38129 | TMBIM4 | 51643 | 219206_x_at | -0.4692 | 0.0005 | |
| GSE45670 | TMBIM4 | 51643 | 222845_x_at | -0.3923 | 0.0066 | |
| GSE53622 | TMBIM4 | 51643 | 61429 | -0.7390 | 0.0000 | |
| GSE53624 | TMBIM4 | 51643 | 61429 | -0.6851 | 0.0000 | |
| GSE63941 | TMBIM4 | 51643 | 223892_s_at | -1.0449 | 0.0294 | |
| GSE77861 | TMBIM4 | 51643 | 222845_x_at | -0.6788 | 0.0023 | |
| GSE97050 | TMBIM4 | 51643 | A_33_P3223544 | -0.1956 | 0.3680 | |
| SRP007169 | TMBIM4 | 51643 | RNAseq | -1.2564 | 0.0002 | |
| SRP008496 | TMBIM4 | 51643 | RNAseq | -1.0215 | 0.0001 | |
| SRP064894 | TMBIM4 | 51643 | RNAseq | -0.2184 | 0.1896 | |
| SRP133303 | TMBIM4 | 51643 | RNAseq | -0.2191 | 0.0902 | |
| SRP159526 | TMBIM4 | 51643 | RNAseq | -0.4449 | 0.1535 | |
| SRP193095 | TMBIM4 | 51643 | RNAseq | -0.8448 | 0.0000 | |
| SRP219564 | TMBIM4 | 51643 | RNAseq | -0.0166 | 0.9611 | |
| TCGA | TMBIM4 | 51643 | RNAseq | -0.2365 | 0.0002 |
Upregulated datasets: 0; Downregulated datasets: 3.
Survival by TMBIM4 expression:
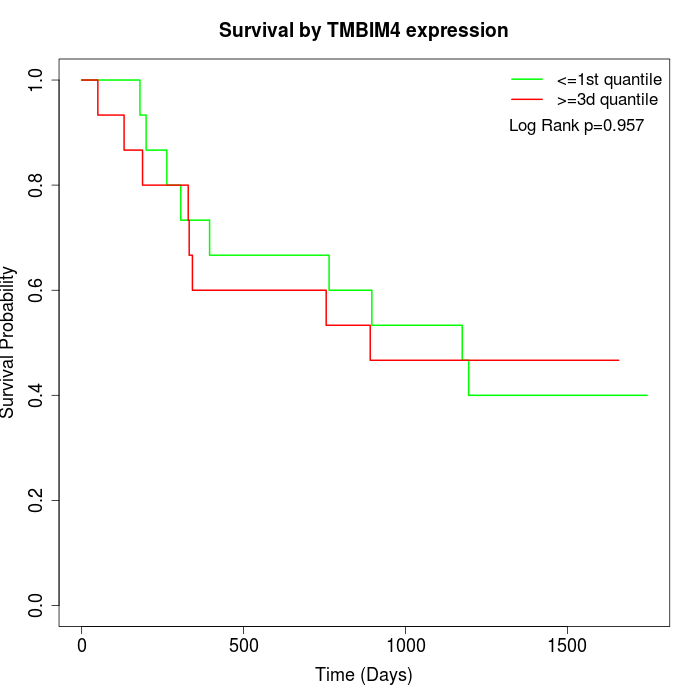 | 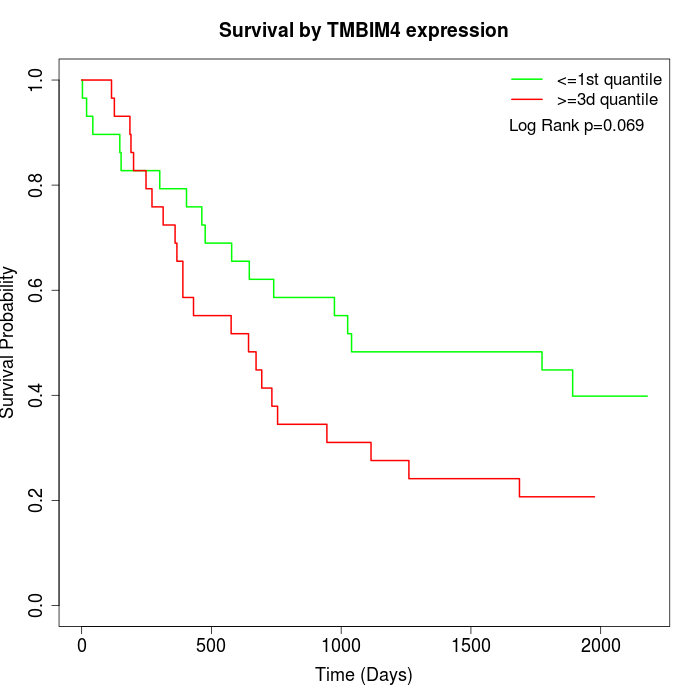 | 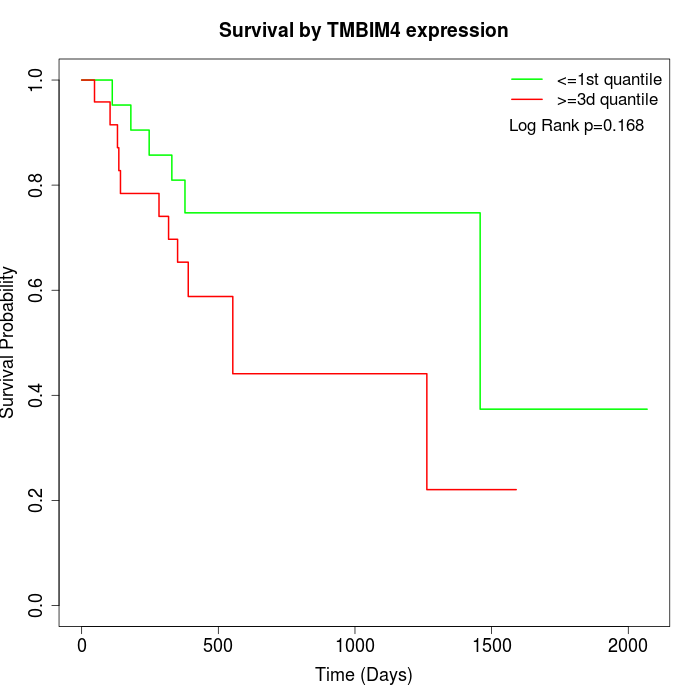 |
| GSE53622 | GSE53624 | TCGA |
Note: Click image to view full size file.
Copy number change of TMBIM4:
| Dataset | Gene | EntrezID | Gain | Loss | Normal | Detail |
|---|---|---|---|---|---|---|
| GSE15526 | TMBIM4 | 51643 | 5 | 1 | 24 | |
| GSE20123 | TMBIM4 | 51643 | 5 | 1 | 24 | |
| GSE43470 | TMBIM4 | 51643 | 5 | 0 | 38 | |
| GSE46452 | TMBIM4 | 51643 | 13 | 0 | 46 | |
| GSE47630 | TMBIM4 | 51643 | 10 | 1 | 29 | |
| GSE54993 | TMBIM4 | 51643 | 0 | 7 | 63 | |
| GSE54994 | TMBIM4 | 51643 | 6 | 1 | 46 | |
| GSE60625 | TMBIM4 | 51643 | 0 | 0 | 11 | |
| GSE74703 | TMBIM4 | 51643 | 5 | 0 | 31 | |
| GSE74704 | TMBIM4 | 51643 | 4 | 1 | 15 | |
| TCGA | TMBIM4 | 51643 | 24 | 9 | 63 |
Total number of gains: 77; Total number of losses: 21; Total Number of normals: 390.
Somatic mutations of TMBIM4:
Generating mutation plots.
Highly correlated genes for TMBIM4:
Showing top 20/1093 corelated genes with mean PCC>0.5.
| Gene1 | Gene2 | Mean PCC | Num. Datasets | Num. PCC<0 | Num. PCC>0.5 |
|---|---|---|---|---|---|
| TMBIM4 | GLUD2 | 0.749478 | 3 | 0 | 3 |
| TMBIM4 | RAB21 | 0.734024 | 4 | 0 | 4 |
| TMBIM4 | ZNF585A | 0.724567 | 3 | 0 | 3 |
| TMBIM4 | AQR | 0.722973 | 3 | 0 | 3 |
| TMBIM4 | ATF6 | 0.721127 | 4 | 0 | 3 |
| TMBIM4 | GUF1 | 0.71824 | 4 | 0 | 4 |
| TMBIM4 | SNX12 | 0.709597 | 3 | 0 | 3 |
| TMBIM4 | RSRC2 | 0.708735 | 4 | 0 | 4 |
| TMBIM4 | MAPK1 | 0.708673 | 4 | 0 | 3 |
| TMBIM4 | PUM2 | 0.705576 | 3 | 0 | 3 |
| TMBIM4 | RBM20 | 0.704587 | 5 | 0 | 5 |
| TMBIM4 | CSDE1 | 0.701378 | 6 | 0 | 6 |
| TMBIM4 | COG5 | 0.698183 | 4 | 0 | 3 |
| TMBIM4 | NIPSNAP3A | 0.69316 | 7 | 0 | 5 |
| TMBIM4 | NTAN1 | 0.692349 | 4 | 0 | 3 |
| TMBIM4 | GTF2H5 | 0.689165 | 5 | 0 | 4 |
| TMBIM4 | PHLDA1 | 0.687845 | 3 | 0 | 3 |
| TMBIM4 | ZCCHC9 | 0.687483 | 4 | 0 | 3 |
| TMBIM4 | NCOA2 | 0.679556 | 8 | 0 | 8 |
| TMBIM4 | AZIN1 | 0.673688 | 3 | 0 | 3 |
For details and further investigation, click here