| Full name: pleckstrin homology like domain family A member 1 | Alias Symbol: TDAG51|DT1P1B11|PHRIP | ||
| Type: protein-coding gene | Cytoband: 12q15 | ||
| Entrez ID: 22822 | HGNC ID: HGNC:8933 | Ensembl Gene: ENSG00000139289 | OMIM ID: 605335 |
Expression of PHLDA1:
| Dataset | Gene | EntrezID | Probe | Log2FC | Adj.pValue | Expression |
|---|---|---|---|---|---|---|
| GSE17351 | PHLDA1 | 22822 | 217996_at | -1.4627 | 0.3053 | |
| GSE20347 | PHLDA1 | 22822 | 217996_at | -2.0770 | 0.0000 | |
| GSE23400 | PHLDA1 | 22822 | 217996_at | -1.9987 | 0.0000 | |
| GSE26886 | PHLDA1 | 22822 | 217996_at | -3.4485 | 0.0000 | |
| GSE29001 | PHLDA1 | 22822 | 217996_at | -2.0531 | 0.0005 | |
| GSE38129 | PHLDA1 | 22822 | 217996_at | -1.3194 | 0.0014 | |
| GSE45670 | PHLDA1 | 22822 | 217996_at | -0.5095 | 0.2248 | |
| GSE53622 | PHLDA1 | 22822 | 24545 | -0.6340 | 0.0000 | |
| GSE53624 | PHLDA1 | 22822 | 24545 | -1.1751 | 0.0000 | |
| GSE63941 | PHLDA1 | 22822 | 217996_at | -1.5576 | 0.1478 | |
| GSE77861 | PHLDA1 | 22822 | 217996_at | -1.0568 | 0.0068 | |
| GSE97050 | PHLDA1 | 22822 | A_24_P915692 | 0.3250 | 0.5212 | |
| SRP007169 | PHLDA1 | 22822 | RNAseq | -2.2894 | 0.0000 | |
| SRP008496 | PHLDA1 | 22822 | RNAseq | -2.0927 | 0.0000 | |
| SRP064894 | PHLDA1 | 22822 | RNAseq | -1.3285 | 0.0000 | |
| SRP133303 | PHLDA1 | 22822 | RNAseq | -0.8663 | 0.0000 | |
| SRP159526 | PHLDA1 | 22822 | RNAseq | -1.2549 | 0.0003 | |
| SRP193095 | PHLDA1 | 22822 | RNAseq | -1.1125 | 0.0004 | |
| SRP219564 | PHLDA1 | 22822 | RNAseq | -1.6279 | 0.0045 | |
| TCGA | PHLDA1 | 22822 | RNAseq | -0.0783 | 0.4053 |
Upregulated datasets: 0; Downregulated datasets: 13.
Survival by PHLDA1 expression:
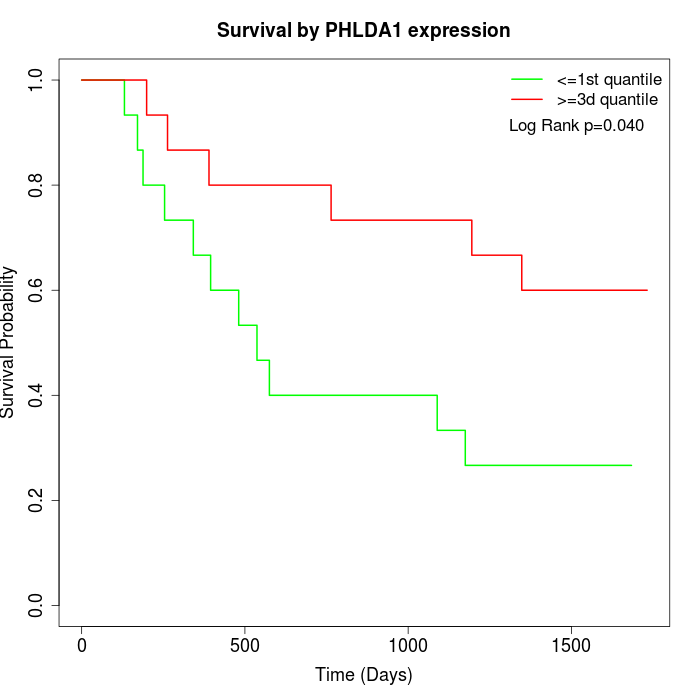 | 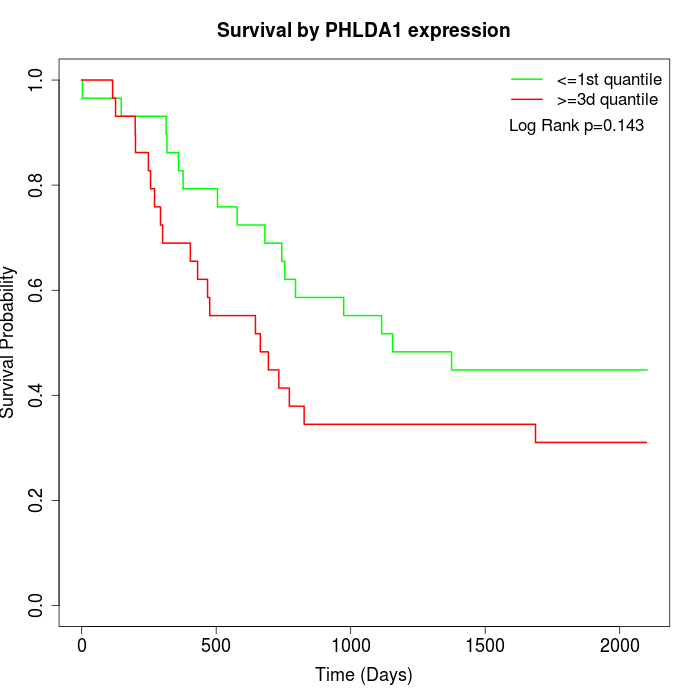 | 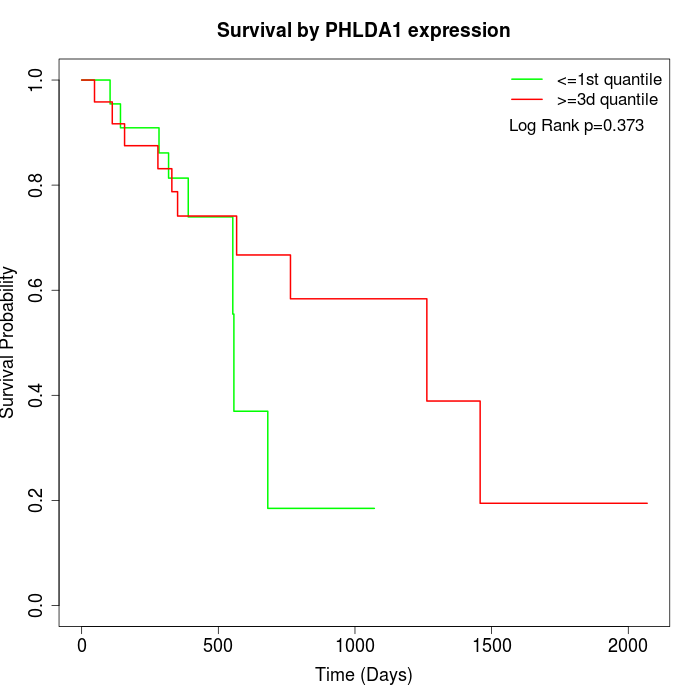 |
| GSE53622 | GSE53624 | TCGA |
Note: Click image to view full size file.
Copy number change of PHLDA1:
| Dataset | Gene | EntrezID | Gain | Loss | Normal | Detail |
|---|---|---|---|---|---|---|
| GSE15526 | PHLDA1 | 22822 | 3 | 3 | 24 | |
| GSE20123 | PHLDA1 | 22822 | 3 | 3 | 24 | |
| GSE43470 | PHLDA1 | 22822 | 3 | 1 | 39 | |
| GSE46452 | PHLDA1 | 22822 | 8 | 1 | 50 | |
| GSE47630 | PHLDA1 | 22822 | 10 | 1 | 29 | |
| GSE54993 | PHLDA1 | 22822 | 0 | 5 | 65 | |
| GSE54994 | PHLDA1 | 22822 | 5 | 2 | 46 | |
| GSE60625 | PHLDA1 | 22822 | 0 | 0 | 11 | |
| GSE74703 | PHLDA1 | 22822 | 3 | 1 | 32 | |
| GSE74704 | PHLDA1 | 22822 | 2 | 2 | 16 | |
| TCGA | PHLDA1 | 22822 | 14 | 15 | 67 |
Total number of gains: 51; Total number of losses: 34; Total Number of normals: 403.
Somatic mutations of PHLDA1:
Generating mutation plots.
Highly correlated genes for PHLDA1:
Showing top 20/1190 corelated genes with mean PCC>0.5.
| Gene1 | Gene2 | Mean PCC | Num. Datasets | Num. PCC<0 | Num. PCC>0.5 |
|---|---|---|---|---|---|
| PHLDA1 | SNX14 | 0.831569 | 3 | 0 | 3 |
| PHLDA1 | ECM1 | 0.763927 | 11 | 0 | 11 |
| PHLDA1 | MXD1 | 0.763259 | 11 | 0 | 10 |
| PHLDA1 | ZNF365 | 0.74267 | 10 | 0 | 10 |
| PHLDA1 | GYS2 | 0.739734 | 10 | 0 | 10 |
| PHLDA1 | TMOD3 | 0.738987 | 11 | 0 | 10 |
| PHLDA1 | ZNF460 | 0.737739 | 3 | 0 | 3 |
| PHLDA1 | PSCA | 0.737596 | 8 | 0 | 8 |
| PHLDA1 | GDPD3 | 0.737093 | 10 | 0 | 10 |
| PHLDA1 | FAM122C | 0.73689 | 3 | 0 | 3 |
| PHLDA1 | CRCT1 | 0.736581 | 11 | 0 | 11 |
| PHLDA1 | WDR26 | 0.734288 | 10 | 0 | 10 |
| PHLDA1 | PDCD6IP | 0.733047 | 11 | 0 | 11 |
| PHLDA1 | EHD3 | 0.732098 | 11 | 0 | 11 |
| PHLDA1 | TOM1L1 | 0.730064 | 3 | 0 | 3 |
| PHLDA1 | CRISP3 | 0.729562 | 10 | 0 | 10 |
| PHLDA1 | DUSP5 | 0.729329 | 13 | 0 | 12 |
| PHLDA1 | IL36A | 0.729123 | 10 | 0 | 10 |
| PHLDA1 | CWH43 | 0.725967 | 10 | 0 | 10 |
| PHLDA1 | SFTA2 | 0.725041 | 4 | 0 | 4 |
For details and further investigation, click here