| Full name: tumor suppressor candidate 1 | Alias Symbol: TSG-9|CCDC89B | ||
| Type: protein-coding gene | Cytoband: 9p21.2 | ||
| Entrez ID: 286319 | HGNC ID: HGNC:31010 | Ensembl Gene: ENSG00000198680 | OMIM ID: 610529 |
| Drug and gene relationship at DGIdb | |||
Expression of TUSC1:
| Dataset | Gene | EntrezID | Probe | Log2FC | Adj.pValue | Expression |
|---|---|---|---|---|---|---|
| GSE17351 | TUSC1 | 286319 | 227388_at | -0.1519 | 0.9142 | |
| GSE26886 | TUSC1 | 286319 | 227388_at | 0.6951 | 0.0707 | |
| GSE45670 | TUSC1 | 286319 | 227388_at | -0.0683 | 0.8826 | |
| GSE53622 | TUSC1 | 286319 | 11631 | 0.1065 | 0.0413 | |
| GSE53624 | TUSC1 | 286319 | 11631 | 0.0590 | 0.3223 | |
| GSE63941 | TUSC1 | 286319 | 227388_at | -0.7679 | 0.6256 | |
| GSE77861 | TUSC1 | 286319 | 227388_at | -0.6842 | 0.0974 | |
| GSE97050 | TUSC1 | 286319 | A_33_P3278033 | 0.0846 | 0.6699 | |
| SRP007169 | TUSC1 | 286319 | RNAseq | -0.6742 | 0.3327 | |
| SRP064894 | TUSC1 | 286319 | RNAseq | 0.3986 | 0.2783 | |
| SRP133303 | TUSC1 | 286319 | RNAseq | 0.4488 | 0.1492 | |
| SRP159526 | TUSC1 | 286319 | RNAseq | -0.0257 | 0.9454 | |
| SRP193095 | TUSC1 | 286319 | RNAseq | 0.2480 | 0.2779 | |
| SRP219564 | TUSC1 | 286319 | RNAseq | -0.0981 | 0.8629 | |
| TCGA | TUSC1 | 286319 | RNAseq | -0.0035 | 0.9801 |
Upregulated datasets: 0; Downregulated datasets: 0.
Survival by TUSC1 expression:
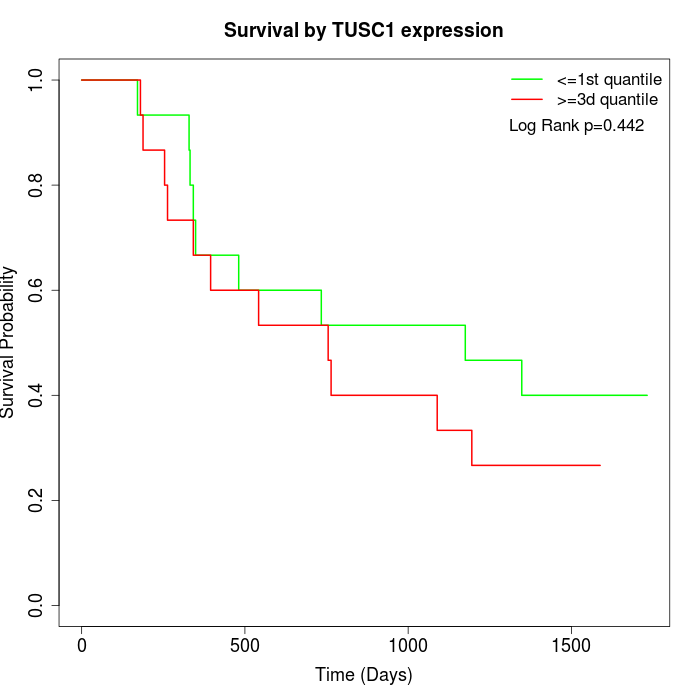 | 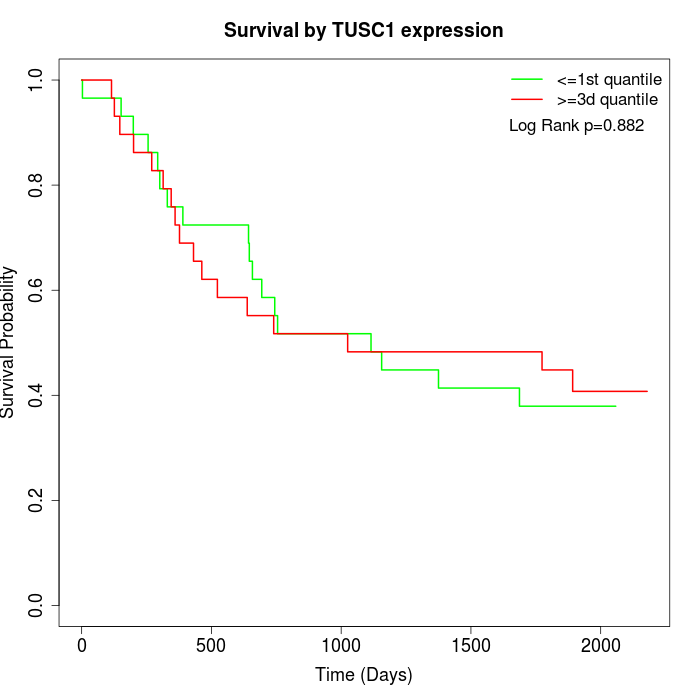 | 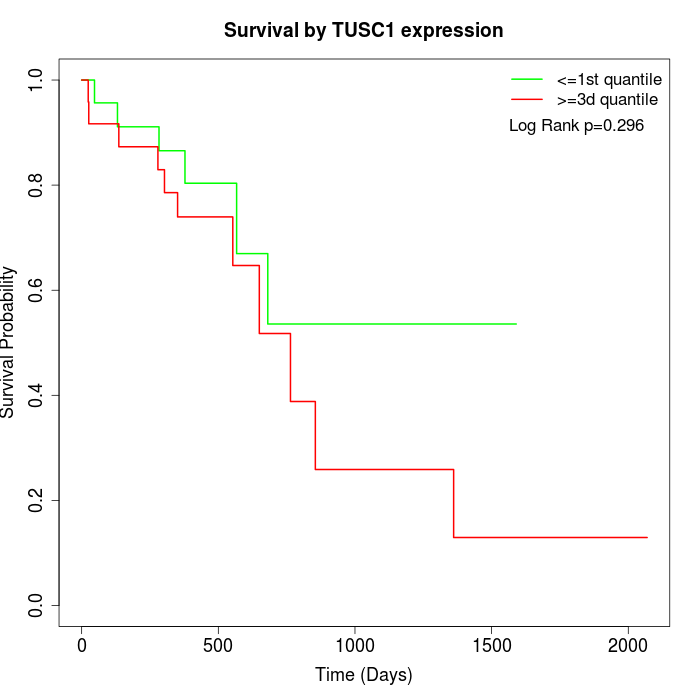 |
| GSE53622 | GSE53624 | TCGA |
Note: Click image to view full size file.
Copy number change of TUSC1:
| Dataset | Gene | EntrezID | Gain | Loss | Normal | Detail |
|---|---|---|---|---|---|---|
| GSE15526 | TUSC1 | 286319 | 3 | 14 | 13 | |
| GSE20123 | TUSC1 | 286319 | 3 | 14 | 13 | |
| GSE43470 | TUSC1 | 286319 | 1 | 14 | 28 | |
| GSE46452 | TUSC1 | 286319 | 6 | 18 | 35 | |
| GSE47630 | TUSC1 | 286319 | 1 | 22 | 17 | |
| GSE54993 | TUSC1 | 286319 | 7 | 0 | 63 | |
| GSE54994 | TUSC1 | 286319 | 7 | 15 | 31 | |
| GSE60625 | TUSC1 | 286319 | 0 | 0 | 11 | |
| GSE74703 | TUSC1 | 286319 | 1 | 11 | 24 | |
| GSE74704 | TUSC1 | 286319 | 1 | 11 | 8 | |
| TCGA | TUSC1 | 286319 | 16 | 48 | 32 |
Total number of gains: 46; Total number of losses: 167; Total Number of normals: 275.
Somatic mutations of TUSC1:
Generating mutation plots.
Highly correlated genes for TUSC1:
Showing top 20/160 corelated genes with mean PCC>0.5.
| Gene1 | Gene2 | Mean PCC | Num. Datasets | Num. PCC<0 | Num. PCC>0.5 |
|---|---|---|---|---|---|
| TUSC1 | SHISA7 | 0.763631 | 3 | 0 | 3 |
| TUSC1 | KCNH3 | 0.758029 | 3 | 0 | 3 |
| TUSC1 | PVALB | 0.756964 | 3 | 0 | 3 |
| TUSC1 | AGRP | 0.752576 | 3 | 0 | 3 |
| TUSC1 | STRC | 0.752087 | 3 | 0 | 3 |
| TUSC1 | GRIK4 | 0.751354 | 3 | 0 | 3 |
| TUSC1 | CHMP6 | 0.749853 | 3 | 0 | 3 |
| TUSC1 | CELF5 | 0.746203 | 3 | 0 | 3 |
| TUSC1 | TMEM102 | 0.741304 | 3 | 0 | 3 |
| TUSC1 | SUN5 | 0.73823 | 3 | 0 | 3 |
| TUSC1 | FGFR4 | 0.735297 | 3 | 0 | 3 |
| TUSC1 | CHD5 | 0.73282 | 3 | 0 | 3 |
| TUSC1 | ZNF527 | 0.73139 | 3 | 0 | 3 |
| TUSC1 | SPACA3 | 0.727652 | 4 | 0 | 3 |
| TUSC1 | MOB1B | 0.727321 | 3 | 0 | 3 |
| TUSC1 | DCDC1 | 0.725344 | 3 | 0 | 3 |
| TUSC1 | C2CD4D | 0.725215 | 3 | 0 | 3 |
| TUSC1 | ODF3L2 | 0.723564 | 3 | 0 | 3 |
| TUSC1 | GPR150 | 0.71903 | 3 | 0 | 3 |
| TUSC1 | LHX9 | 0.718172 | 3 | 0 | 3 |
For details and further investigation, click here