| Full name: ubiquitin specific peptidase 31 | Alias Symbol: KIAA1203 | ||
| Type: protein-coding gene | Cytoband: 16p12.2 | ||
| Entrez ID: 57478 | HGNC ID: HGNC:20060 | Ensembl Gene: ENSG00000103404 | OMIM ID: |
Expression of USP31:
| Dataset | Gene | EntrezID | Probe | Log2FC | Adj.pValue | Expression |
|---|---|---|---|---|---|---|
| GSE17351 | USP31 | 57478 | 226035_at | 0.2822 | 0.6477 | |
| GSE26886 | USP31 | 57478 | 226035_at | 0.0062 | 0.9881 | |
| GSE45670 | USP31 | 57478 | 226035_at | 0.2273 | 0.1695 | |
| GSE63941 | USP31 | 57478 | 226035_at | 1.6215 | 0.0131 | |
| GSE77861 | USP31 | 57478 | 226035_at | 0.8047 | 0.1504 | |
| GSE97050 | USP31 | 57478 | A_23_P206612 | 0.2661 | 0.2371 | |
| SRP007169 | USP31 | 57478 | RNAseq | 1.1265 | 0.0049 | |
| SRP008496 | USP31 | 57478 | RNAseq | 1.4978 | 0.0000 | |
| SRP064894 | USP31 | 57478 | RNAseq | 0.4625 | 0.0270 | |
| SRP133303 | USP31 | 57478 | RNAseq | 0.8647 | 0.0003 | |
| SRP159526 | USP31 | 57478 | RNAseq | 0.7148 | 0.0036 | |
| SRP193095 | USP31 | 57478 | RNAseq | 0.7164 | 0.0005 | |
| SRP219564 | USP31 | 57478 | RNAseq | 0.8364 | 0.0956 | |
| TCGA | USP31 | 57478 | RNAseq | 0.2040 | 0.0017 |
Upregulated datasets: 3; Downregulated datasets: 0.
Survival by USP31 expression:
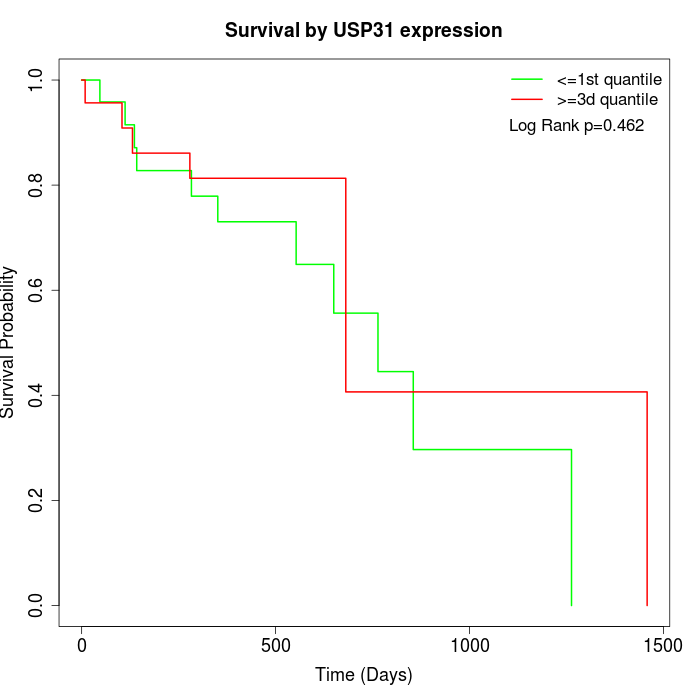 |
| TCGA |
Note: Click image to view full size file.
Copy number change of USP31:
| Dataset | Gene | EntrezID | Gain | Loss | Normal | Detail |
|---|---|---|---|---|---|---|
| GSE15526 | USP31 | 57478 | 6 | 4 | 20 | |
| GSE20123 | USP31 | 57478 | 6 | 3 | 21 | |
| GSE43470 | USP31 | 57478 | 3 | 3 | 37 | |
| GSE46452 | USP31 | 57478 | 38 | 1 | 20 | |
| GSE47630 | USP31 | 57478 | 11 | 6 | 23 | |
| GSE54993 | USP31 | 57478 | 3 | 5 | 62 | |
| GSE54994 | USP31 | 57478 | 4 | 10 | 39 | |
| GSE60625 | USP31 | 57478 | 4 | 0 | 7 | |
| GSE74703 | USP31 | 57478 | 3 | 2 | 31 | |
| GSE74704 | USP31 | 57478 | 3 | 1 | 16 | |
| TCGA | USP31 | 57478 | 19 | 13 | 64 |
Total number of gains: 100; Total number of losses: 48; Total Number of normals: 340.
Somatic mutations of USP31:
Generating mutation plots.
Highly correlated genes for USP31:
Showing top 20/240 corelated genes with mean PCC>0.5.
| Gene1 | Gene2 | Mean PCC | Num. Datasets | Num. PCC<0 | Num. PCC>0.5 |
|---|---|---|---|---|---|
| USP31 | AP2B1 | 0.769782 | 3 | 0 | 3 |
| USP31 | TINAGL1 | 0.742096 | 3 | 0 | 3 |
| USP31 | ZNF275 | 0.726096 | 3 | 0 | 3 |
| USP31 | BRAT1 | 0.718409 | 3 | 0 | 3 |
| USP31 | FCHSD2 | 0.710004 | 3 | 0 | 3 |
| USP31 | MDM1 | 0.708298 | 3 | 0 | 3 |
| USP31 | CERS5 | 0.693781 | 3 | 0 | 3 |
| USP31 | ZNF512 | 0.688475 | 3 | 0 | 3 |
| USP31 | ECSIT | 0.687989 | 3 | 0 | 3 |
| USP31 | DHX35 | 0.687111 | 3 | 0 | 3 |
| USP31 | PRSS23 | 0.686735 | 3 | 0 | 3 |
| USP31 | ASAP2 | 0.686259 | 3 | 0 | 3 |
| USP31 | FLVCR1 | 0.682195 | 3 | 0 | 3 |
| USP31 | SLC25A33 | 0.680873 | 3 | 0 | 3 |
| USP31 | DDX10 | 0.680752 | 3 | 0 | 3 |
| USP31 | HSF2 | 0.680401 | 3 | 0 | 3 |
| USP31 | SOX13 | 0.680119 | 3 | 0 | 3 |
| USP31 | FKBP9 | 0.678662 | 3 | 0 | 3 |
| USP31 | TARBP1 | 0.677608 | 3 | 0 | 3 |
| USP31 | INTS7 | 0.674951 | 3 | 0 | 3 |
For details and further investigation, click here