| Full name: adaptor related protein complex 2 subunit beta 1 | Alias Symbol: | ||
| Type: protein-coding gene | Cytoband: 17q12 | ||
| Entrez ID: 163 | HGNC ID: HGNC:563 | Ensembl Gene: ENSG00000006125 | OMIM ID: 601025 |
Screen Evidence:
| |||
AP2B1 involved pathways:
| KEGG pathway | Description | View |
|---|---|---|
| hsa05016 | Huntington's disease |
Expression of AP2B1:
| Dataset | Gene | EntrezID | Probe | Log2FC | Adj.pValue | Expression |
|---|---|---|---|---|---|---|
| GSE17351 | AP2B1 | 163 | 200612_s_at | 0.5111 | 0.4328 | |
| GSE20347 | AP2B1 | 163 | 200612_s_at | 0.2311 | 0.1241 | |
| GSE23400 | AP2B1 | 163 | 200612_s_at | 0.4056 | 0.0000 | |
| GSE26886 | AP2B1 | 163 | 200615_s_at | 2.1174 | 0.0000 | |
| GSE29001 | AP2B1 | 163 | 200612_s_at | 0.1509 | 0.6372 | |
| GSE38129 | AP2B1 | 163 | 200612_s_at | 0.2244 | 0.4634 | |
| GSE45670 | AP2B1 | 163 | 200612_s_at | 0.1749 | 0.5231 | |
| GSE53622 | AP2B1 | 163 | 37758 | 0.6512 | 0.0000 | |
| GSE53624 | AP2B1 | 163 | 37758 | 0.7595 | 0.0000 | |
| GSE63941 | AP2B1 | 163 | 200615_s_at | 0.3577 | 0.4386 | |
| GSE77861 | AP2B1 | 163 | 200612_s_at | 0.9172 | 0.0043 | |
| GSE97050 | AP2B1 | 163 | A_24_P253827 | 0.4908 | 0.1433 | |
| SRP007169 | AP2B1 | 163 | RNAseq | 2.1466 | 0.0000 | |
| SRP008496 | AP2B1 | 163 | RNAseq | 2.0384 | 0.0000 | |
| SRP064894 | AP2B1 | 163 | RNAseq | 0.5399 | 0.0070 | |
| SRP133303 | AP2B1 | 163 | RNAseq | 0.7810 | 0.0000 | |
| SRP159526 | AP2B1 | 163 | RNAseq | 0.5449 | 0.0670 | |
| SRP193095 | AP2B1 | 163 | RNAseq | 0.6163 | 0.0053 | |
| SRP219564 | AP2B1 | 163 | RNAseq | 0.4865 | 0.2982 | |
| TCGA | AP2B1 | 163 | RNAseq | -0.0663 | 0.1807 |
Upregulated datasets: 3; Downregulated datasets: 0.
Survival by AP2B1 expression:
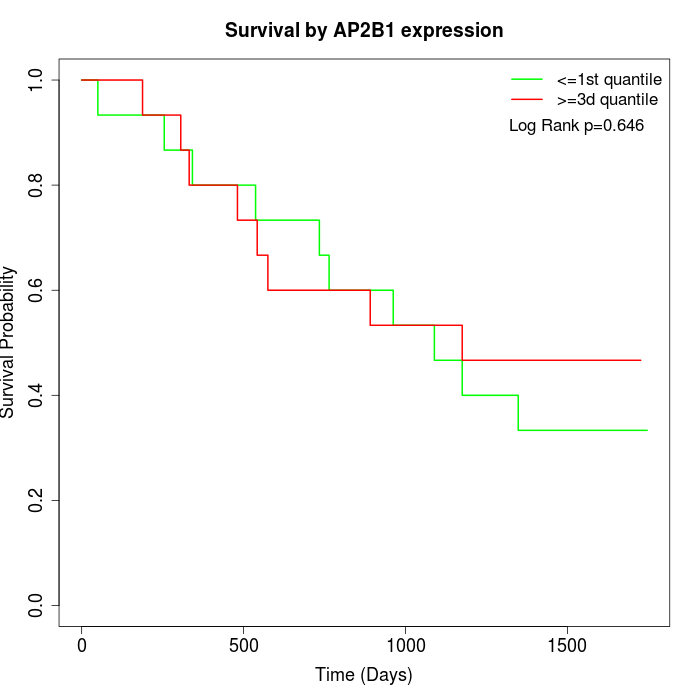 | 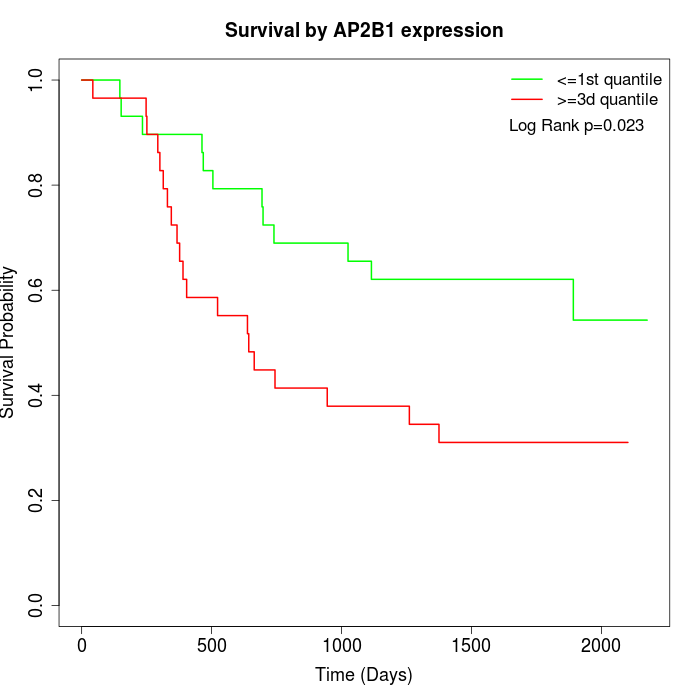 | 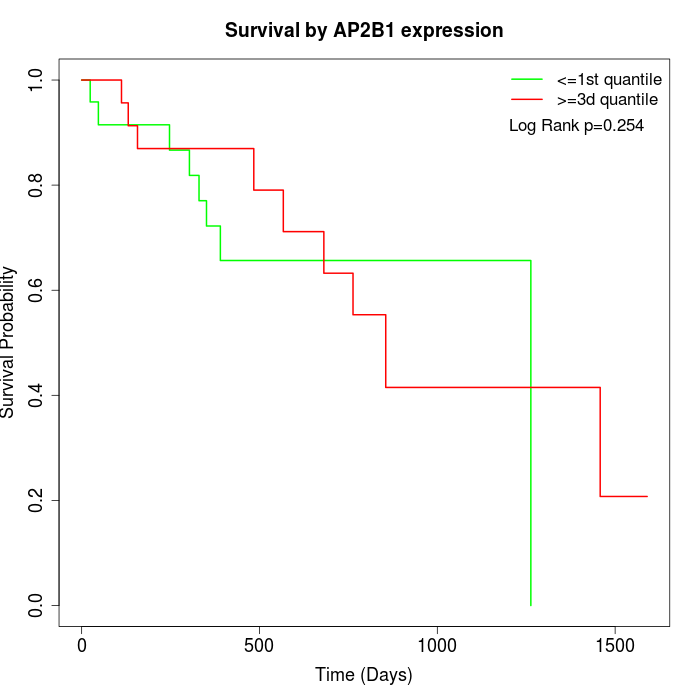 |
| GSE53622 | GSE53624 | TCGA |
Note: Click image to view full size file.
Copy number change of AP2B1:
| Dataset | Gene | EntrezID | Gain | Loss | Normal | Detail |
|---|---|---|---|---|---|---|
| GSE15526 | AP2B1 | 163 | 5 | 1 | 24 | |
| GSE20123 | AP2B1 | 163 | 5 | 1 | 24 | |
| GSE43470 | AP2B1 | 163 | 1 | 2 | 40 | |
| GSE46452 | AP2B1 | 163 | 34 | 0 | 25 | |
| GSE47630 | AP2B1 | 163 | 7 | 1 | 32 | |
| GSE54993 | AP2B1 | 163 | 3 | 3 | 64 | |
| GSE54994 | AP2B1 | 163 | 8 | 6 | 39 | |
| GSE60625 | AP2B1 | 163 | 4 | 0 | 7 | |
| GSE74703 | AP2B1 | 163 | 1 | 1 | 34 | |
| GSE74704 | AP2B1 | 163 | 3 | 1 | 16 | |
| TCGA | AP2B1 | 163 | 20 | 9 | 67 |
Total number of gains: 91; Total number of losses: 25; Total Number of normals: 372.
Somatic mutations of AP2B1:
Generating mutation plots.
Highly correlated genes for AP2B1:
Showing top 20/1715 corelated genes with mean PCC>0.5.
| Gene1 | Gene2 | Mean PCC | Num. Datasets | Num. PCC<0 | Num. PCC>0.5 |
|---|---|---|---|---|---|
| AP2B1 | RAVER1 | 0.830471 | 4 | 0 | 4 |
| AP2B1 | ALKBH6 | 0.80628 | 3 | 0 | 3 |
| AP2B1 | TMTC1 | 0.794059 | 3 | 0 | 3 |
| AP2B1 | KRTCAP2 | 0.792633 | 3 | 0 | 3 |
| AP2B1 | FOSL1 | 0.787689 | 3 | 0 | 3 |
| AP2B1 | USP31 | 0.769782 | 3 | 0 | 3 |
| AP2B1 | SLC39A13 | 0.763478 | 6 | 0 | 6 |
| AP2B1 | RAB34 | 0.760147 | 3 | 0 | 3 |
| AP2B1 | ABCC1 | 0.756906 | 3 | 0 | 3 |
| AP2B1 | KCTD12 | 0.756733 | 3 | 0 | 3 |
| AP2B1 | PET117 | 0.752624 | 3 | 0 | 3 |
| AP2B1 | ZBED1 | 0.74415 | 3 | 0 | 3 |
| AP2B1 | LTBR | 0.741441 | 3 | 0 | 3 |
| AP2B1 | TGFBR2 | 0.739851 | 3 | 0 | 3 |
| AP2B1 | TMEM263 | 0.738651 | 6 | 0 | 6 |
| AP2B1 | FADS1 | 0.734439 | 3 | 0 | 3 |
| AP2B1 | NF1 | 0.729808 | 3 | 0 | 3 |
| AP2B1 | SCYL1 | 0.728929 | 4 | 0 | 4 |
| AP2B1 | AURKAIP1 | 0.727719 | 3 | 0 | 3 |
| AP2B1 | GPR153 | 0.720977 | 3 | 0 | 3 |
For details and further investigation, click here