| Full name: acyl-CoA synthetase bubblegum family member 1 | Alias Symbol: BGM|FLJ30320|MGC14352|BG1|KIAA0631|hBG1|hsBG | ||
| Type: protein-coding gene | Cytoband: 15q25.1 | ||
| Entrez ID: 23205 | HGNC ID: HGNC:29567 | Ensembl Gene: ENSG00000103740 | OMIM ID: 614362 |
ACSBG1 involved pathways:
| KEGG pathway | Description | View |
|---|---|---|
| hsa03320 | PPAR signaling pathway | |
| hsa04920 | Adipocytokine signaling pathway |
Expression of ACSBG1:
| Dataset | Gene | EntrezID | Probe | Log2FC | Adj.pValue | Expression |
|---|---|---|---|---|---|---|
| GSE17351 | ACSBG1 | 23205 | 206465_at | -0.2626 | 0.5347 | |
| GSE20347 | ACSBG1 | 23205 | 206466_at | 0.0040 | 0.9617 | |
| GSE23400 | ACSBG1 | 23205 | 206465_at | -0.1712 | 0.0033 | |
| GSE26886 | ACSBG1 | 23205 | 206466_at | -0.0689 | 0.4917 | |
| GSE29001 | ACSBG1 | 23205 | 206465_at | 0.0496 | 0.9039 | |
| GSE38129 | ACSBG1 | 23205 | 206465_at | -0.1555 | 0.0198 | |
| GSE45670 | ACSBG1 | 23205 | 206465_at | -0.0629 | 0.6289 | |
| GSE53622 | ACSBG1 | 23205 | 46949 | -0.2808 | 0.0402 | |
| GSE53624 | ACSBG1 | 23205 | 46949 | -0.2892 | 0.0013 | |
| GSE63941 | ACSBG1 | 23205 | 206465_at | -0.1533 | 0.3539 | |
| GSE77861 | ACSBG1 | 23205 | 206466_at | -0.0247 | 0.8247 | |
| GSE97050 | ACSBG1 | 23205 | A_23_P54488 | -0.7084 | 0.2310 | |
| SRP133303 | ACSBG1 | 23205 | RNAseq | 0.0936 | 0.5242 | |
| SRP159526 | ACSBG1 | 23205 | RNAseq | -0.2220 | 0.6304 | |
| SRP193095 | ACSBG1 | 23205 | RNAseq | -0.1237 | 0.2907 | |
| SRP219564 | ACSBG1 | 23205 | RNAseq | 0.1459 | 0.7800 | |
| TCGA | ACSBG1 | 23205 | RNAseq | -0.6093 | 0.0264 |
Upregulated datasets: 0; Downregulated datasets: 0.
Survival by ACSBG1 expression:
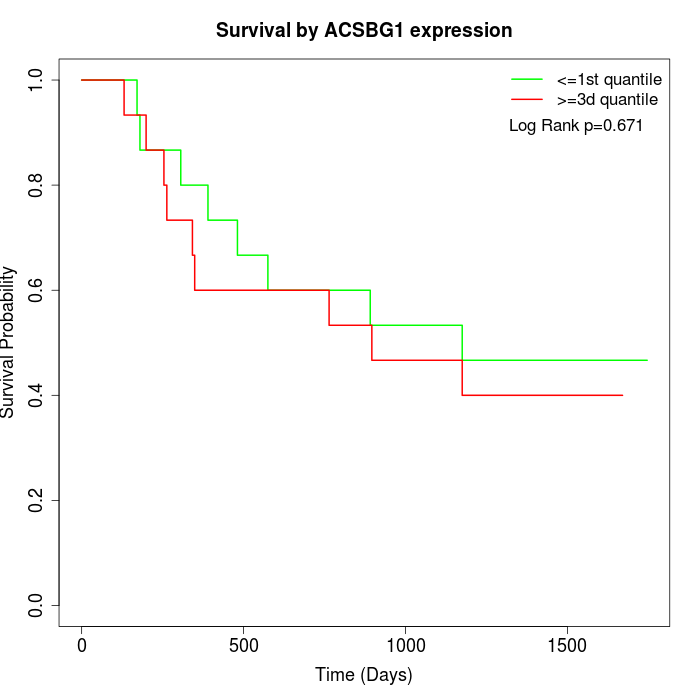 | 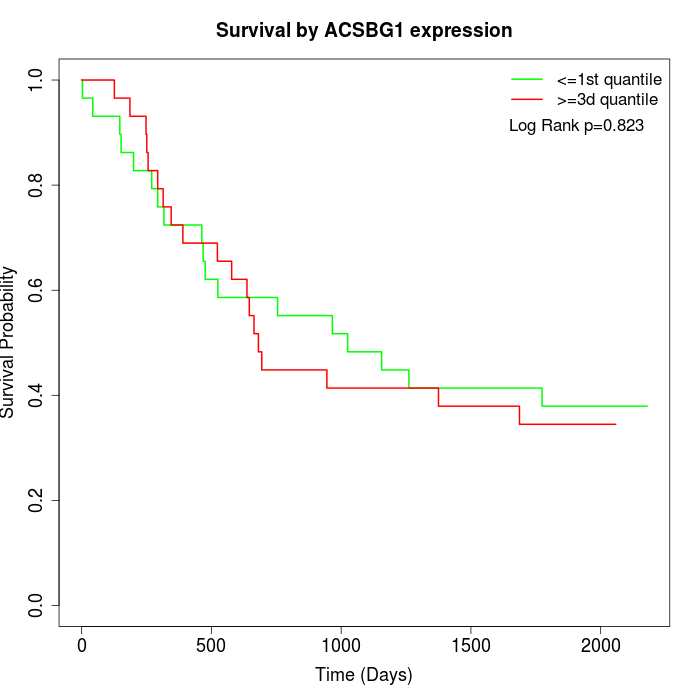 | 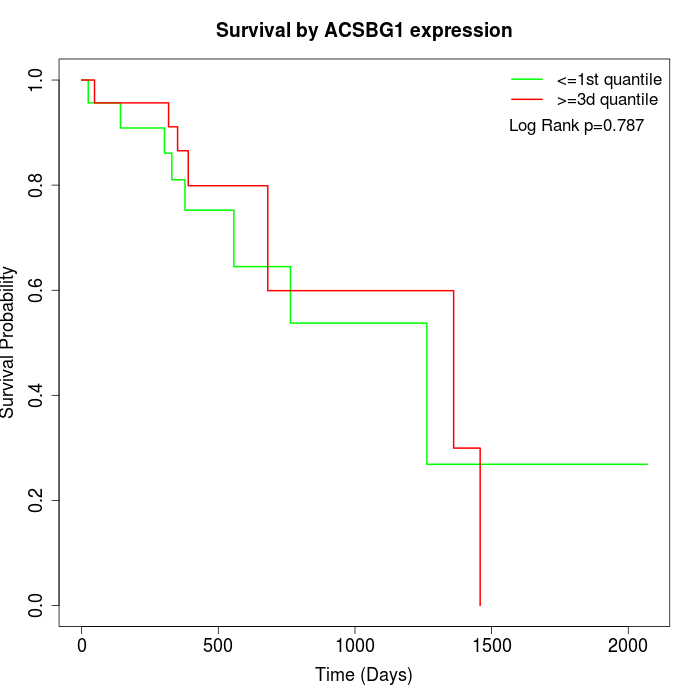 |
| GSE53622 | GSE53624 | TCGA |
Note: Click image to view full size file.
Copy number change of ACSBG1:
| Dataset | Gene | EntrezID | Gain | Loss | Normal | Detail |
|---|---|---|---|---|---|---|
| GSE15526 | ACSBG1 | 23205 | 7 | 1 | 22 | |
| GSE20123 | ACSBG1 | 23205 | 7 | 1 | 22 | |
| GSE43470 | ACSBG1 | 23205 | 4 | 5 | 34 | |
| GSE46452 | ACSBG1 | 23205 | 3 | 7 | 49 | |
| GSE47630 | ACSBG1 | 23205 | 8 | 10 | 22 | |
| GSE54993 | ACSBG1 | 23205 | 5 | 6 | 59 | |
| GSE54994 | ACSBG1 | 23205 | 5 | 6 | 42 | |
| GSE60625 | ACSBG1 | 23205 | 4 | 0 | 7 | |
| GSE74703 | ACSBG1 | 23205 | 4 | 3 | 29 | |
| GSE74704 | ACSBG1 | 23205 | 3 | 1 | 16 | |
| TCGA | ACSBG1 | 23205 | 14 | 15 | 67 |
Total number of gains: 64; Total number of losses: 55; Total Number of normals: 369.
Somatic mutations of ACSBG1:
Generating mutation plots.
Highly correlated genes for ACSBG1:
Showing top 20/223 corelated genes with mean PCC>0.5.
| Gene1 | Gene2 | Mean PCC | Num. Datasets | Num. PCC<0 | Num. PCC>0.5 |
|---|---|---|---|---|---|
| ACSBG1 | GSX1 | 0.713707 | 3 | 0 | 3 |
| ACSBG1 | NHSL2 | 0.710089 | 3 | 0 | 3 |
| ACSBG1 | CDKL5 | 0.704407 | 4 | 0 | 4 |
| ACSBG1 | ABCB11 | 0.698422 | 3 | 0 | 3 |
| ACSBG1 | ZNF839 | 0.683591 | 3 | 0 | 3 |
| ACSBG1 | CBLN1 | 0.673637 | 4 | 0 | 4 |
| ACSBG1 | DCST1 | 0.672667 | 3 | 0 | 3 |
| ACSBG1 | MAPK12 | 0.66688 | 4 | 0 | 4 |
| ACSBG1 | TECTB | 0.662024 | 3 | 0 | 3 |
| ACSBG1 | SPAG8 | 0.660039 | 4 | 0 | 4 |
| ACSBG1 | CD5 | 0.658089 | 3 | 0 | 3 |
| ACSBG1 | AFF3 | 0.657836 | 3 | 0 | 3 |
| ACSBG1 | OBP2A | 0.641458 | 5 | 0 | 4 |
| ACSBG1 | KIF25 | 0.63589 | 4 | 0 | 4 |
| ACSBG1 | SMYD1 | 0.632624 | 4 | 0 | 3 |
| ACSBG1 | SLC35F1 | 0.628034 | 4 | 0 | 4 |
| ACSBG1 | LDB3 | 0.623653 | 5 | 0 | 4 |
| ACSBG1 | PLD6 | 0.620367 | 3 | 0 | 3 |
| ACSBG1 | GUCY2F | 0.619051 | 3 | 0 | 3 |
| ACSBG1 | SHOX | 0.6188 | 4 | 0 | 3 |
For details and further investigation, click here