| Full name: CD5 molecule | Alias Symbol: T1 | ||
| Type: protein-coding gene | Cytoband: 11q12.2 | ||
| Entrez ID: 921 | HGNC ID: HGNC:1685 | Ensembl Gene: ENSG00000110448 | OMIM ID: 153340 |
| Related drugs: DACTINOMYCIN, HEXAMETHYLENEBISACETAMIDE, INOSITOL, IONOMYCIN, PHORBOL MYRISTATE ACETATE, REGRAMOSTIM, ZOLIMOMAB ARITOX... [more] | |||
Expression of CD5:
| Dataset | Gene | EntrezID | Probe | Log2FC | Adj.pValue | Expression |
|---|---|---|---|---|---|---|
| GSE17351 | CD5 | 921 | 206485_at | 0.1111 | 0.7825 | |
| GSE20347 | CD5 | 921 | 206485_at | -0.1041 | 0.3447 | |
| GSE23400 | CD5 | 921 | 206485_at | -0.1765 | 0.0000 | |
| GSE26886 | CD5 | 921 | 206485_at | -0.2168 | 0.1165 | |
| GSE29001 | CD5 | 921 | 206485_at | -0.5570 | 0.0018 | |
| GSE38129 | CD5 | 921 | 206485_at | -0.2508 | 0.0361 | |
| GSE45670 | CD5 | 921 | 206485_at | -0.0191 | 0.8691 | |
| GSE53622 | CD5 | 921 | 24100 | -0.3969 | 0.0310 | |
| GSE53624 | CD5 | 921 | 24100 | -0.4925 | 0.0027 | |
| GSE63941 | CD5 | 921 | 206485_at | 0.1031 | 0.4662 | |
| GSE77861 | CD5 | 921 | 206485_at | -0.2398 | 0.1167 | |
| GSE97050 | CD5 | 921 | A_33_P3298990 | 0.3480 | 0.2366 | |
| SRP064894 | CD5 | 921 | RNAseq | -0.4365 | 0.1591 | |
| SRP133303 | CD5 | 921 | RNAseq | -0.5377 | 0.0060 | |
| SRP159526 | CD5 | 921 | RNAseq | -1.2411 | 0.1931 | |
| SRP193095 | CD5 | 921 | RNAseq | -0.1446 | 0.4712 | |
| SRP219564 | CD5 | 921 | RNAseq | 0.1276 | 0.8046 | |
| TCGA | CD5 | 921 | RNAseq | -0.1048 | 0.6512 |
Upregulated datasets: 0; Downregulated datasets: 0.
Survival by CD5 expression:
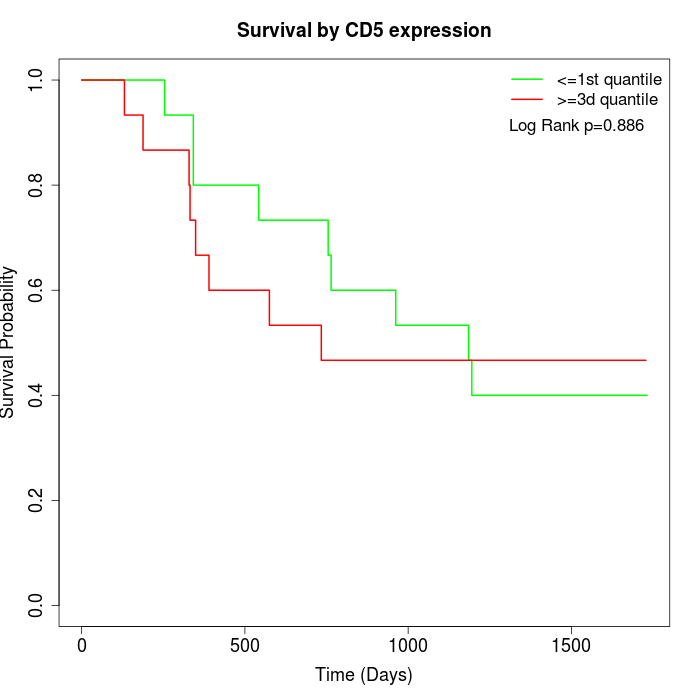 | 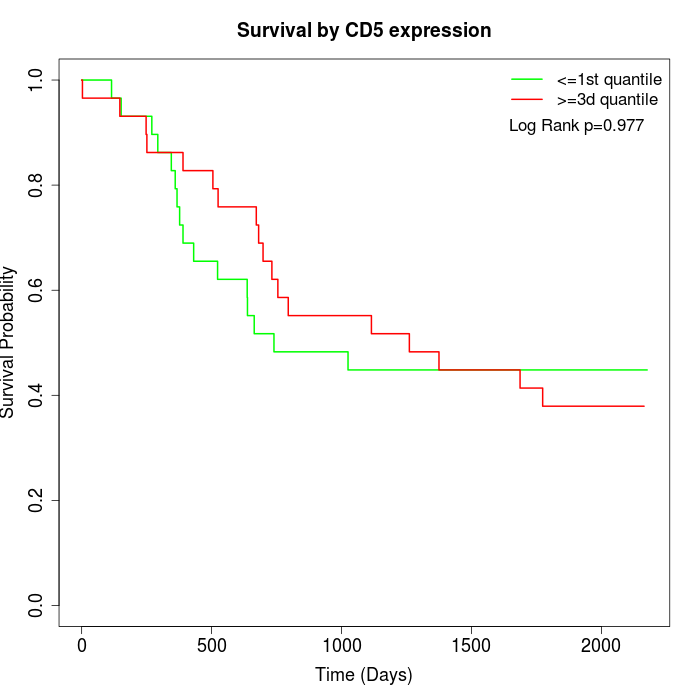 | 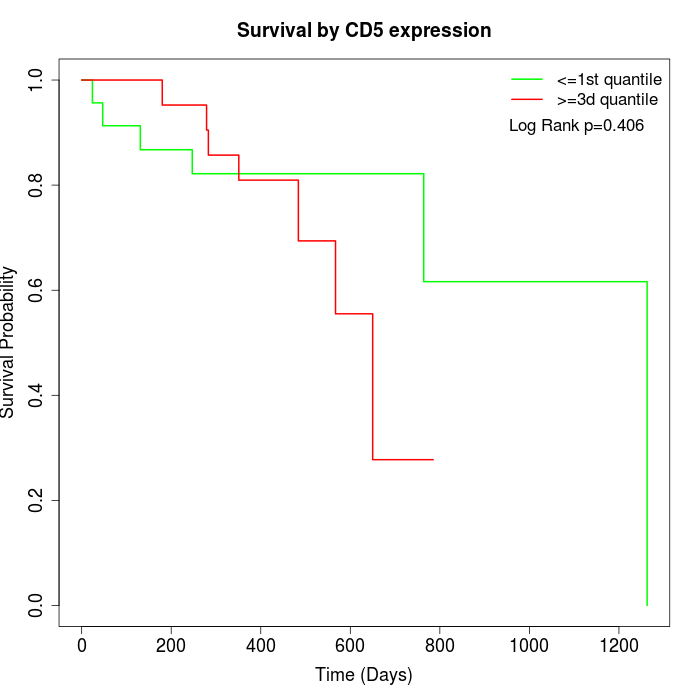 |
| GSE53622 | GSE53624 | TCGA |
Note: Click image to view full size file.
Copy number change of CD5:
| Dataset | Gene | EntrezID | Gain | Loss | Normal | Detail |
|---|---|---|---|---|---|---|
| GSE15526 | CD5 | 921 | 2 | 5 | 23 | |
| GSE20123 | CD5 | 921 | 2 | 5 | 23 | |
| GSE43470 | CD5 | 921 | 2 | 6 | 35 | |
| GSE46452 | CD5 | 921 | 8 | 4 | 47 | |
| GSE47630 | CD5 | 921 | 3 | 8 | 29 | |
| GSE54993 | CD5 | 921 | 3 | 0 | 67 | |
| GSE54994 | CD5 | 921 | 5 | 5 | 43 | |
| GSE60625 | CD5 | 921 | 0 | 3 | 8 | |
| GSE74703 | CD5 | 921 | 2 | 3 | 31 | |
| GSE74704 | CD5 | 921 | 2 | 3 | 15 | |
| TCGA | CD5 | 921 | 15 | 10 | 71 |
Total number of gains: 44; Total number of losses: 52; Total Number of normals: 392.
Somatic mutations of CD5:
Generating mutation plots.
Highly correlated genes for CD5:
Showing top 20/888 corelated genes with mean PCC>0.5.
| Gene1 | Gene2 | Mean PCC | Num. Datasets | Num. PCC<0 | Num. PCC>0.5 |
|---|---|---|---|---|---|
| CD5 | LCK | 0.772688 | 4 | 0 | 4 |
| CD5 | GPR174 | 0.750901 | 3 | 0 | 3 |
| CD5 | CYTIP | 0.72288 | 4 | 0 | 4 |
| CD5 | SLAMF7 | 0.718238 | 5 | 0 | 5 |
| CD5 | SNX20 | 0.710899 | 5 | 0 | 4 |
| CD5 | POU2AF1 | 0.707087 | 3 | 0 | 3 |
| CD5 | COL22A1 | 0.705188 | 3 | 0 | 3 |
| CD5 | IRF4 | 0.701631 | 6 | 0 | 6 |
| CD5 | CD3G | 0.695722 | 5 | 0 | 5 |
| CD5 | SYT13 | 0.694348 | 3 | 0 | 3 |
| CD5 | ARHGAP9 | 0.688597 | 5 | 0 | 4 |
| CD5 | TGFB1 | 0.687666 | 3 | 0 | 3 |
| CD5 | SUSD3 | 0.68673 | 4 | 0 | 4 |
| CD5 | CYP3A43 | 0.686224 | 6 | 0 | 6 |
| CD5 | SHBG | 0.685311 | 5 | 0 | 5 |
| CD5 | TIGIT | 0.675972 | 5 | 0 | 4 |
| CD5 | ACAP1 | 0.674336 | 5 | 0 | 4 |
| CD5 | IL12RB1 | 0.673915 | 9 | 0 | 8 |
| CD5 | TBX6 | 0.673163 | 5 | 0 | 4 |
| CD5 | PIWIL2 | 0.671776 | 5 | 0 | 5 |
For details and further investigation, click here