| Full name: odorant binding protein 2A | Alias Symbol: hOBPIIa|OBP|LCN13 | ||
| Type: protein-coding gene | Cytoband: 9q34.3 | ||
| Entrez ID: 29991 | HGNC ID: HGNC:23380 | Ensembl Gene: ENSG00000122136 | OMIM ID: 164320 |
Expression of OBP2A:
| Dataset | Gene | EntrezID | Probe | Log2FC | Adj.pValue | Expression |
|---|---|---|---|---|---|---|
| GSE17351 | OBP2A | 29991 | 234841_x_at | -0.0721 | 0.7559 | |
| GSE20347 | OBP2A | 29991 | 220848_x_at | -0.1135 | 0.1342 | |
| GSE23400 | OBP2A | 29991 | 220848_x_at | -0.0584 | 0.0591 | |
| GSE26886 | OBP2A | 29991 | 234841_x_at | -0.0759 | 0.5001 | |
| GSE29001 | OBP2A | 29991 | 220848_x_at | -0.0473 | 0.7568 | |
| GSE38129 | OBP2A | 29991 | 220848_x_at | -0.1362 | 0.0512 | |
| GSE45670 | OBP2A | 29991 | 234841_x_at | -0.0150 | 0.8860 | |
| GSE53622 | OBP2A | 29991 | 51444 | 0.0866 | 0.4681 | |
| GSE53624 | OBP2A | 29991 | 51444 | 0.4702 | 0.0000 | |
| GSE63941 | OBP2A | 29991 | 234841_x_at | 0.1432 | 0.3612 | |
| GSE77861 | OBP2A | 29991 | 220848_x_at | -0.1402 | 0.3394 | |
| GSE97050 | OBP2A | 29991 | A_23_P112327 | -0.0451 | 0.8335 | |
| TCGA | OBP2A | 29991 | RNAseq | 3.7479 | 0.0025 |
Upregulated datasets: 1; Downregulated datasets: 0.
Survival by OBP2A expression:
 | 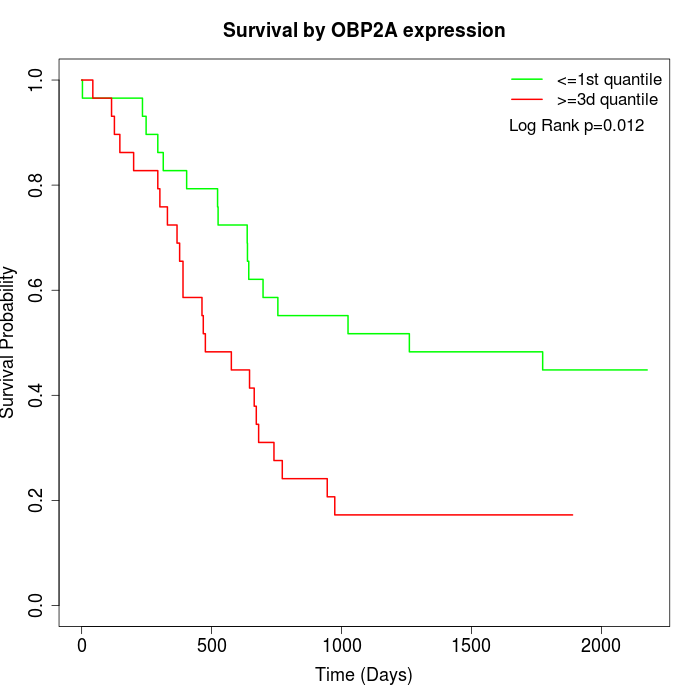 | 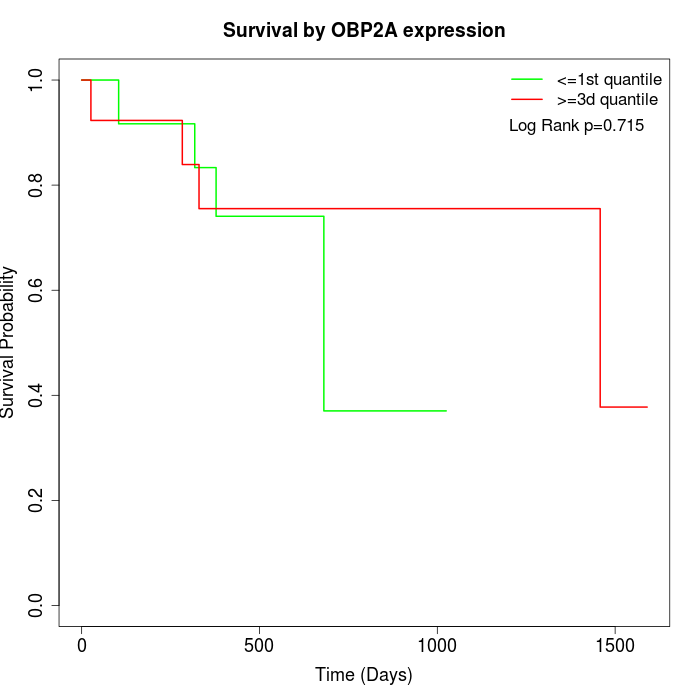 |
| GSE53622 | GSE53624 | TCGA |
Note: Click image to view full size file.
Copy number change of OBP2A:
| Dataset | Gene | EntrezID | Gain | Loss | Normal | Detail |
|---|---|---|---|---|---|---|
| GSE15526 | OBP2A | 29991 | 4 | 7 | 19 | |
| GSE20123 | OBP2A | 29991 | 4 | 7 | 19 | |
| GSE43470 | OBP2A | 29991 | 3 | 7 | 33 | |
| GSE46452 | OBP2A | 29991 | 6 | 13 | 40 | |
| GSE47630 | OBP2A | 29991 | 6 | 15 | 19 | |
| GSE54993 | OBP2A | 29991 | 3 | 3 | 64 | |
| GSE54994 | OBP2A | 29991 | 11 | 9 | 33 | |
| GSE60625 | OBP2A | 29991 | 0 | 0 | 11 | |
| GSE74703 | OBP2A | 29991 | 3 | 5 | 28 | |
| GSE74704 | OBP2A | 29991 | 2 | 5 | 13 | |
| TCGA | OBP2A | 29991 | 28 | 25 | 43 |
Total number of gains: 70; Total number of losses: 96; Total Number of normals: 322.
Somatic mutations of OBP2A:
Generating mutation plots.
Highly correlated genes for OBP2A:
Showing top 20/578 corelated genes with mean PCC>0.5.
| Gene1 | Gene2 | Mean PCC | Num. Datasets | Num. PCC<0 | Num. PCC>0.5 |
|---|---|---|---|---|---|
| OBP2A | KLF14 | 0.762998 | 3 | 0 | 3 |
| OBP2A | DNM3 | 0.711153 | 3 | 0 | 3 |
| OBP2A | LYVE1 | 0.706107 | 3 | 0 | 3 |
| OBP2A | UNK | 0.704642 | 3 | 0 | 3 |
| OBP2A | MID2 | 0.701842 | 3 | 0 | 3 |
| OBP2A | NRXN2 | 0.700191 | 3 | 0 | 3 |
| OBP2A | KRT81 | 0.696699 | 3 | 0 | 3 |
| OBP2A | FLI1 | 0.69612 | 3 | 0 | 3 |
| OBP2A | RNF31 | 0.6929 | 4 | 0 | 4 |
| OBP2A | SIX5 | 0.687774 | 3 | 0 | 3 |
| OBP2A | DMPK | 0.68721 | 3 | 0 | 3 |
| OBP2A | LRRC3B | 0.68641 | 3 | 0 | 3 |
| OBP2A | PNLIP | 0.672475 | 3 | 0 | 3 |
| OBP2A | LDB3 | 0.667902 | 6 | 0 | 5 |
| OBP2A | MSI1 | 0.662746 | 3 | 0 | 3 |
| OBP2A | TBC1D25 | 0.659579 | 3 | 0 | 3 |
| OBP2A | GNG3 | 0.656877 | 5 | 0 | 4 |
| OBP2A | TPSG1 | 0.655067 | 7 | 0 | 6 |
| OBP2A | JMJD4 | 0.654364 | 3 | 0 | 3 |
| OBP2A | ZNF358 | 0.654141 | 4 | 0 | 4 |
For details and further investigation, click here