| Full name: actinin alpha 3 (gene/pseudogene) | Alias Symbol: | ||
| Type: protein-coding gene | Cytoband: 11q13.2 | ||
| Entrez ID: 89 | HGNC ID: HGNC:165 | Ensembl Gene: ENSG00000248746 | OMIM ID: 102574 |
ACTN3 involved pathways:
| KEGG pathway | Description | View |
|---|---|---|
| hsa04510 | Focal adhesion | |
| hsa04520 | Adherens junction | |
| hsa04530 | Tight junction | |
| hsa04810 | Regulation of actin cytoskeleton |
Expression of ACTN3:
| Dataset | Gene | EntrezID | Probe | Log2FC | Adj.pValue | Expression |
|---|---|---|---|---|---|---|
| GSE17351 | ACTN3 | 89 | 206891_at | -0.2364 | 0.2485 | |
| GSE20347 | ACTN3 | 89 | 206891_at | -0.1429 | 0.0411 | |
| GSE23400 | ACTN3 | 89 | 206891_at | -0.3585 | 0.0000 | |
| GSE26886 | ACTN3 | 89 | 206891_at | 0.0576 | 0.6811 | |
| GSE29001 | ACTN3 | 89 | 206891_at | -0.1827 | 0.2168 | |
| GSE38129 | ACTN3 | 89 | 206891_at | -0.2013 | 0.0009 | |
| GSE45670 | ACTN3 | 89 | 206891_at | -0.0172 | 0.8542 | |
| GSE53622 | ACTN3 | 89 | 111020 | 0.3210 | 0.0193 | |
| GSE53624 | ACTN3 | 89 | 111020 | 0.3405 | 0.0025 | |
| GSE63941 | ACTN3 | 89 | 206891_at | -0.0740 | 0.6403 | |
| GSE77861 | ACTN3 | 89 | 206891_at | -0.0674 | 0.6395 | |
| GSE97050 | ACTN3 | 89 | A_23_P138881 | -0.2946 | 0.2722 | |
| TCGA | ACTN3 | 89 | RNAseq | 0.9679 | 0.3210 |
Upregulated datasets: 0; Downregulated datasets: 0.
Survival by ACTN3 expression:
 |  | 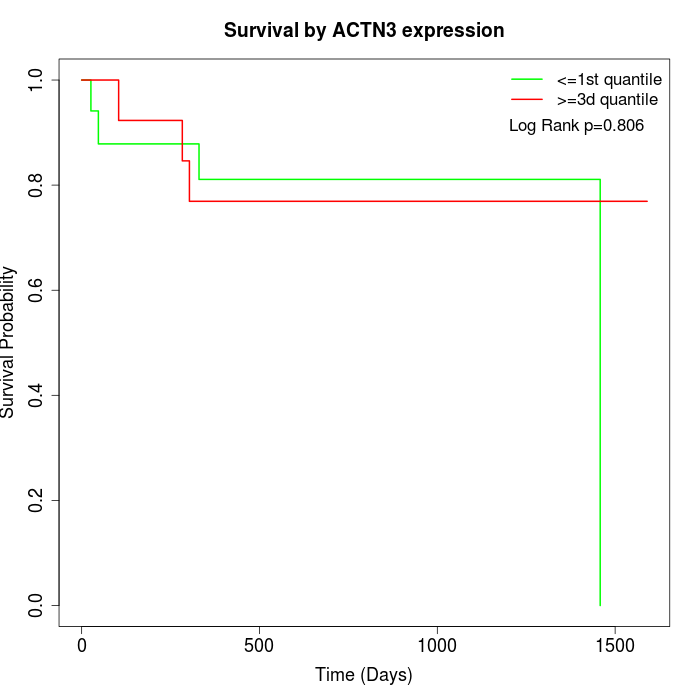 |
| GSE53622 | GSE53624 | TCGA |
Note: Click image to view full size file.
Copy number change of ACTN3:
| Dataset | Gene | EntrezID | Gain | Loss | Normal | Detail |
|---|---|---|---|---|---|---|
| GSE15526 | ACTN3 | 89 | 9 | 4 | 17 | |
| GSE20123 | ACTN3 | 89 | 9 | 4 | 17 | |
| GSE43470 | ACTN3 | 89 | 6 | 1 | 36 | |
| GSE46452 | ACTN3 | 89 | 12 | 3 | 44 | |
| GSE47630 | ACTN3 | 89 | 9 | 4 | 27 | |
| GSE54993 | ACTN3 | 89 | 3 | 0 | 67 | |
| GSE54994 | ACTN3 | 89 | 9 | 5 | 39 | |
| GSE60625 | ACTN3 | 89 | 0 | 3 | 8 | |
| GSE74703 | ACTN3 | 89 | 4 | 0 | 32 | |
| GSE74704 | ACTN3 | 89 | 7 | 2 | 11 | |
| TCGA | ACTN3 | 89 | 27 | 6 | 63 |
Total number of gains: 95; Total number of losses: 32; Total Number of normals: 361.
Somatic mutations of ACTN3:
Generating mutation plots.
Highly correlated genes for ACTN3:
Showing top 20/541 corelated genes with mean PCC>0.5.
| Gene1 | Gene2 | Mean PCC | Num. Datasets | Num. PCC<0 | Num. PCC>0.5 |
|---|---|---|---|---|---|
| ACTN3 | CAB39L | 0.654942 | 5 | 0 | 5 |
| ACTN3 | GALNT9 | 0.652345 | 3 | 0 | 3 |
| ACTN3 | ARHGAP10 | 0.651514 | 4 | 0 | 3 |
| ACTN3 | ACTRT1 | 0.650133 | 3 | 0 | 3 |
| ACTN3 | TULP2 | 0.649366 | 7 | 0 | 6 |
| ACTN3 | AMELX | 0.644317 | 4 | 0 | 3 |
| ACTN3 | IFNA21 | 0.637306 | 6 | 0 | 5 |
| ACTN3 | TICAM1 | 0.636882 | 3 | 0 | 3 |
| ACTN3 | PHLDB1 | 0.633358 | 7 | 0 | 6 |
| ACTN3 | TOM1L2 | 0.62881 | 4 | 0 | 4 |
| ACTN3 | CD300LB | 0.620613 | 3 | 0 | 3 |
| ACTN3 | ART1 | 0.618223 | 6 | 0 | 5 |
| ACTN3 | DOT1L | 0.617773 | 4 | 0 | 3 |
| ACTN3 | NTSR1 | 0.617353 | 4 | 0 | 3 |
| ACTN3 | ZNF717 | 0.615403 | 4 | 0 | 3 |
| ACTN3 | CRYBA4 | 0.613217 | 5 | 0 | 4 |
| ACTN3 | CAPN11 | 0.612497 | 5 | 0 | 3 |
| ACTN3 | EFR3B | 0.605799 | 5 | 0 | 4 |
| ACTN3 | KSR2 | 0.604332 | 3 | 0 | 3 |
| ACTN3 | PDYN | 0.604038 | 5 | 0 | 4 |
For details and further investigation, click here