| Full name: ArfGAP with dual PH domains 1 | Alias Symbol: GCS1L | ||
| Type: protein-coding gene | Cytoband: 7p22.3 | ||
| Entrez ID: 11033 | HGNC ID: HGNC:16486 | Ensembl Gene: ENSG00000105963 | OMIM ID: 608114 |
Screen Evidence:
| |||
Expression of ADAP1:
| Dataset | Gene | EntrezID | Probe | Log2FC | Adj.pValue | Expression |
|---|---|---|---|---|---|---|
| GSE17351 | ADAP1 | 11033 | 90265_at | -0.2660 | 0.4616 | |
| GSE20347 | ADAP1 | 11033 | 90265_at | 0.0299 | 0.8621 | |
| GSE23400 | ADAP1 | 11033 | 90265_at | -0.0663 | 0.3252 | |
| GSE26886 | ADAP1 | 11033 | 90265_at | 0.8463 | 0.0049 | |
| GSE29001 | ADAP1 | 11033 | 90265_at | -0.1808 | 0.5270 | |
| GSE38129 | ADAP1 | 11033 | 90265_at | -0.1076 | 0.4786 | |
| GSE45670 | ADAP1 | 11033 | 90265_at | -0.0326 | 0.8891 | |
| GSE53622 | ADAP1 | 11033 | 18052 | -0.1150 | 0.2839 | |
| GSE53624 | ADAP1 | 11033 | 18052 | 0.1155 | 0.1813 | |
| GSE63941 | ADAP1 | 11033 | 90265_at | 1.5544 | 0.0100 | |
| GSE77861 | ADAP1 | 11033 | 90265_at | 0.2918 | 0.0805 | |
| GSE97050 | ADAP1 | 11033 | A_33_P3422133 | -0.0821 | 0.6986 | |
| SRP007169 | ADAP1 | 11033 | RNAseq | -0.6760 | 0.1473 | |
| SRP064894 | ADAP1 | 11033 | RNAseq | -0.2361 | 0.5320 | |
| SRP133303 | ADAP1 | 11033 | RNAseq | -0.0485 | 0.8992 | |
| SRP159526 | ADAP1 | 11033 | RNAseq | 0.6429 | 0.0875 | |
| SRP193095 | ADAP1 | 11033 | RNAseq | -0.0546 | 0.8889 | |
| SRP219564 | ADAP1 | 11033 | RNAseq | -0.3375 | 0.6475 | |
| TCGA | ADAP1 | 11033 | RNAseq | -0.3584 | 0.0033 |
Upregulated datasets: 1; Downregulated datasets: 0.
Survival by ADAP1 expression:
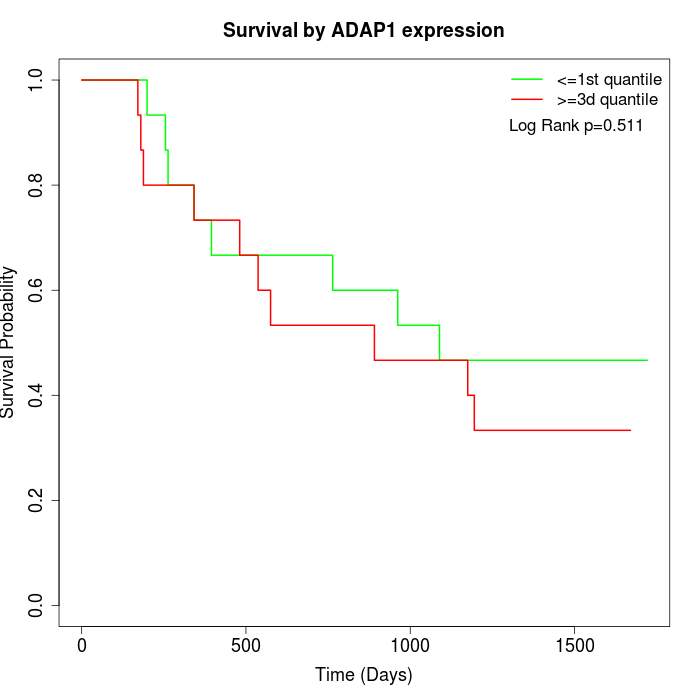 | 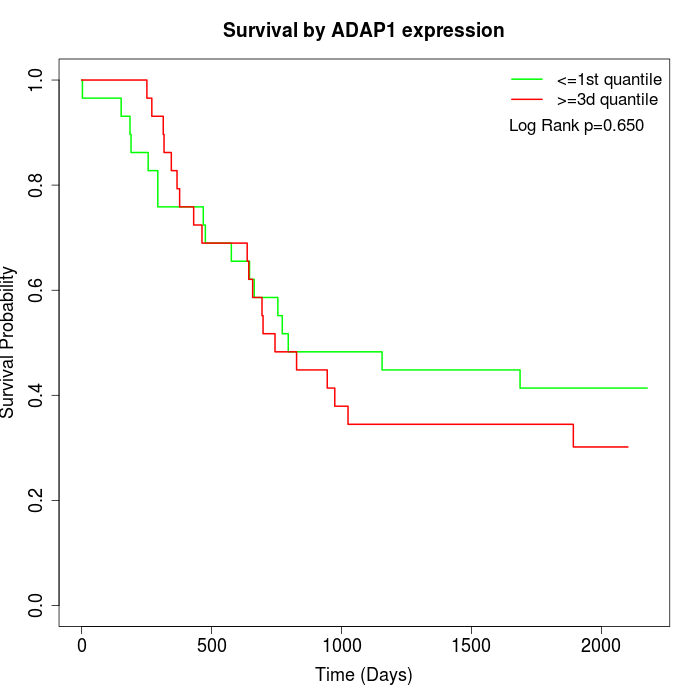 | 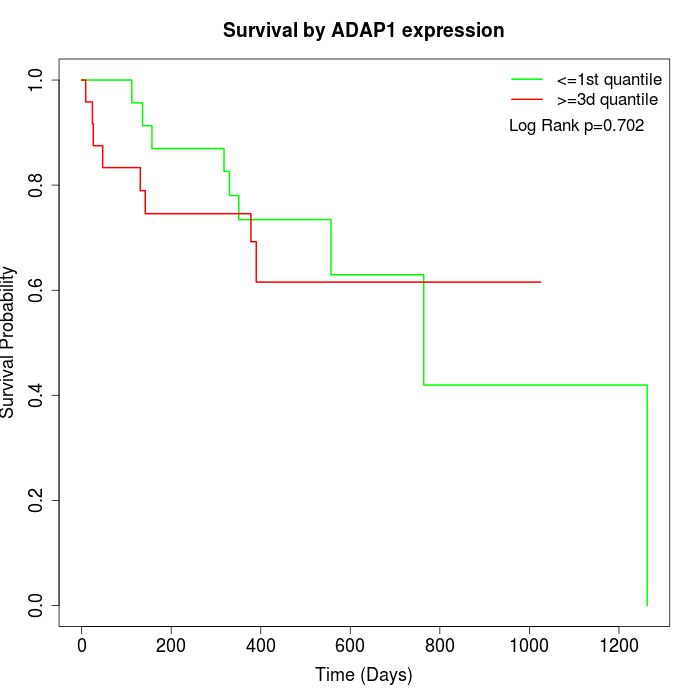 |
| GSE53622 | GSE53624 | TCGA |
Note: Click image to view full size file.
Copy number change of ADAP1:
| Dataset | Gene | EntrezID | Gain | Loss | Normal | Detail |
|---|---|---|---|---|---|---|
| GSE15526 | ADAP1 | 11033 | 14 | 0 | 16 | |
| GSE20123 | ADAP1 | 11033 | 14 | 0 | 16 | |
| GSE43470 | ADAP1 | 11033 | 6 | 2 | 35 | |
| GSE46452 | ADAP1 | 11033 | 13 | 1 | 45 | |
| GSE47630 | ADAP1 | 11033 | 12 | 1 | 27 | |
| GSE54993 | ADAP1 | 11033 | 3 | 10 | 57 | |
| GSE54994 | ADAP1 | 11033 | 20 | 3 | 30 | |
| GSE60625 | ADAP1 | 11033 | 0 | 0 | 11 | |
| GSE74703 | ADAP1 | 11033 | 6 | 1 | 29 | |
| GSE74704 | ADAP1 | 11033 | 9 | 0 | 11 | |
| TCGA | ADAP1 | 11033 | 56 | 6 | 34 |
Total number of gains: 153; Total number of losses: 24; Total Number of normals: 311.
Somatic mutations of ADAP1:
Generating mutation plots.
Highly correlated genes for ADAP1:
Showing top 20/485 corelated genes with mean PCC>0.5.
| Gene1 | Gene2 | Mean PCC | Num. Datasets | Num. PCC<0 | Num. PCC>0.5 |
|---|---|---|---|---|---|
| ADAP1 | BMF | 0.802562 | 3 | 0 | 3 |
| ADAP1 | C20orf144 | 0.781597 | 3 | 0 | 3 |
| ADAP1 | ITGA10 | 0.767947 | 3 | 0 | 3 |
| ADAP1 | FHAD1 | 0.764969 | 3 | 0 | 3 |
| ADAP1 | SP8 | 0.764651 | 4 | 0 | 4 |
| ADAP1 | EFNB1 | 0.762403 | 3 | 0 | 3 |
| ADAP1 | CCDC57 | 0.756426 | 3 | 0 | 3 |
| ADAP1 | GPSM3 | 0.75513 | 3 | 0 | 3 |
| ADAP1 | KAT2A | 0.746047 | 4 | 0 | 4 |
| ADAP1 | SOX12 | 0.744421 | 3 | 0 | 3 |
| ADAP1 | FUZ | 0.743658 | 3 | 0 | 3 |
| ADAP1 | FOXL2 | 0.736031 | 3 | 0 | 3 |
| ADAP1 | LRSAM1 | 0.733028 | 3 | 0 | 3 |
| ADAP1 | SPTBN4 | 0.731935 | 4 | 0 | 3 |
| ADAP1 | GSDMD | 0.730557 | 3 | 0 | 3 |
| ADAP1 | CABP4 | 0.728377 | 5 | 0 | 5 |
| ADAP1 | MUC8 | 0.726966 | 4 | 0 | 3 |
| ADAP1 | OR1F1 | 0.72488 | 4 | 0 | 4 |
| ADAP1 | CACTIN | 0.721405 | 4 | 0 | 4 |
| ADAP1 | SDK1 | 0.71984 | 3 | 0 | 3 |
For details and further investigation, click here