| Full name: lysine acetyltransferase 2A | Alias Symbol: GCN5|PCAF-b | ||
| Type: protein-coding gene | Cytoband: 17q21.2 | ||
| Entrez ID: 2648 | HGNC ID: HGNC:4201 | Ensembl Gene: ENSG00000108773 | OMIM ID: 602301 |
Screen Evidence:
| |||
KAT2A involved pathways:
| KEGG pathway | Description | View |
|---|---|---|
| hsa04330 | Notch signaling pathway |
Expression of KAT2A:
| Dataset | Gene | EntrezID | Probe | Log2FC | Adj.pValue | Expression |
|---|---|---|---|---|---|---|
| GSE17351 | KAT2A | 2648 | 202182_at | 0.3122 | 0.1513 | |
| GSE20347 | KAT2A | 2648 | 202182_at | 0.5185 | 0.0000 | |
| GSE23400 | KAT2A | 2648 | 202182_at | 0.3788 | 0.0000 | |
| GSE26886 | KAT2A | 2648 | 202182_at | 0.8086 | 0.0000 | |
| GSE29001 | KAT2A | 2648 | 202182_at | 0.3530 | 0.1645 | |
| GSE38129 | KAT2A | 2648 | 202182_at | 0.4668 | 0.0000 | |
| GSE45670 | KAT2A | 2648 | 202182_at | 0.2561 | 0.1160 | |
| GSE53622 | KAT2A | 2648 | 66178 | 0.6060 | 0.0000 | |
| GSE53624 | KAT2A | 2648 | 66178 | 0.6226 | 0.0000 | |
| GSE63941 | KAT2A | 2648 | 202182_at | 0.4962 | 0.0515 | |
| GSE77861 | KAT2A | 2648 | 202182_at | 0.4647 | 0.0160 | |
| GSE97050 | KAT2A | 2648 | A_23_P66608 | 0.3146 | 0.3048 | |
| SRP007169 | KAT2A | 2648 | RNAseq | 1.5059 | 0.0001 | |
| SRP008496 | KAT2A | 2648 | RNAseq | 1.1847 | 0.0000 | |
| SRP064894 | KAT2A | 2648 | RNAseq | 0.8328 | 0.0000 | |
| SRP133303 | KAT2A | 2648 | RNAseq | 0.1590 | 0.3660 | |
| SRP159526 | KAT2A | 2648 | RNAseq | 0.3383 | 0.1700 | |
| SRP193095 | KAT2A | 2648 | RNAseq | 0.6456 | 0.0000 | |
| SRP219564 | KAT2A | 2648 | RNAseq | 0.3445 | 0.4562 | |
| TCGA | KAT2A | 2648 | RNAseq | 0.2671 | 0.0000 |
Upregulated datasets: 2; Downregulated datasets: 0.
Survival by KAT2A expression:
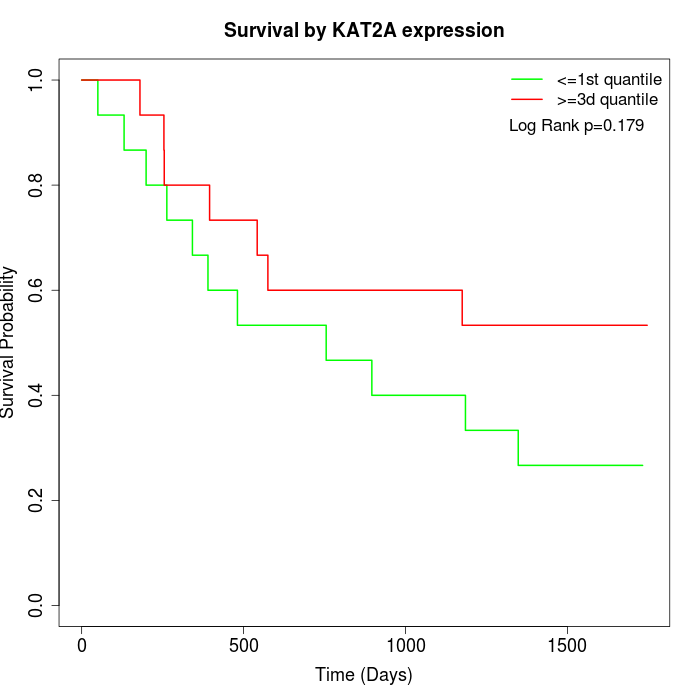 |  |  |
| GSE53622 | GSE53624 | TCGA |
Note: Click image to view full size file.
Copy number change of KAT2A:
| Dataset | Gene | EntrezID | Gain | Loss | Normal | Detail |
|---|---|---|---|---|---|---|
| GSE15526 | KAT2A | 2648 | 6 | 2 | 22 | |
| GSE20123 | KAT2A | 2648 | 6 | 2 | 22 | |
| GSE43470 | KAT2A | 2648 | 1 | 2 | 40 | |
| GSE46452 | KAT2A | 2648 | 34 | 0 | 25 | |
| GSE47630 | KAT2A | 2648 | 8 | 1 | 31 | |
| GSE54993 | KAT2A | 2648 | 3 | 4 | 63 | |
| GSE54994 | KAT2A | 2648 | 8 | 5 | 40 | |
| GSE60625 | KAT2A | 2648 | 4 | 0 | 7 | |
| GSE74703 | KAT2A | 2648 | 1 | 1 | 34 | |
| GSE74704 | KAT2A | 2648 | 4 | 1 | 15 | |
| TCGA | KAT2A | 2648 | 23 | 6 | 67 |
Total number of gains: 98; Total number of losses: 24; Total Number of normals: 366.
Somatic mutations of KAT2A:
Generating mutation plots.
Highly correlated genes for KAT2A:
Showing top 20/606 corelated genes with mean PCC>0.5.
| Gene1 | Gene2 | Mean PCC | Num. Datasets | Num. PCC<0 | Num. PCC>0.5 |
|---|---|---|---|---|---|
| KAT2A | ZDHHC23 | 0.756354 | 3 | 0 | 3 |
| KAT2A | FBRSL1 | 0.750339 | 4 | 0 | 4 |
| KAT2A | ADAP1 | 0.746047 | 4 | 0 | 4 |
| KAT2A | SCYL1 | 0.723948 | 3 | 0 | 3 |
| KAT2A | LRWD1 | 0.723448 | 3 | 0 | 3 |
| KAT2A | ATAD3C | 0.721622 | 3 | 0 | 3 |
| KAT2A | BMF | 0.712318 | 4 | 0 | 3 |
| KAT2A | RIMBP2 | 0.708695 | 3 | 0 | 3 |
| KAT2A | ALKBH2 | 0.705947 | 4 | 0 | 4 |
| KAT2A | TMEM63A | 0.702103 | 3 | 0 | 3 |
| KAT2A | NR2E1 | 0.700839 | 3 | 0 | 3 |
| KAT2A | ZNF48 | 0.694938 | 3 | 0 | 3 |
| KAT2A | C20orf144 | 0.692908 | 3 | 0 | 3 |
| KAT2A | PRKAR1B | 0.692641 | 3 | 0 | 3 |
| KAT2A | SMPD4 | 0.690727 | 3 | 0 | 3 |
| KAT2A | LRFN3 | 0.687673 | 4 | 0 | 3 |
| KAT2A | RIPPLY3 | 0.681567 | 3 | 0 | 3 |
| KAT2A | PRMT3 | 0.679221 | 4 | 0 | 3 |
| KAT2A | POLR2H | 0.672632 | 11 | 0 | 10 |
| KAT2A | WDR90 | 0.67159 | 8 | 0 | 6 |
For details and further investigation, click here