| Full name: angiotensinogen | Alias Symbol: | ||
| Type: protein-coding gene | Cytoband: 1q42.2 | ||
| Entrez ID: 183 | HGNC ID: HGNC:333 | Ensembl Gene: ENSG00000135744 | OMIM ID: 106150 |
| Related drugs: CYCLOSPORINE, ENALAPRIL, HYDROCORTISONE, MESTRANOL, QUINAPRIL... [more] | |||
Expression of AGT:
| Dataset | Gene | EntrezID | Probe | Log2FC | Adj.pValue | Expression |
|---|---|---|---|---|---|---|
| GSE17351 | AGT | 183 | 202834_at | 0.0551 | 0.9581 | |
| GSE20347 | AGT | 183 | 202834_at | 0.0406 | 0.7145 | |
| GSE23400 | AGT | 183 | 202834_at | -0.0193 | 0.7179 | |
| GSE26886 | AGT | 183 | 202834_at | 0.3713 | 0.0355 | |
| GSE29001 | AGT | 183 | 202834_at | -0.0558 | 0.6112 | |
| GSE38129 | AGT | 183 | 202834_at | -0.1674 | 0.5265 | |
| GSE45670 | AGT | 183 | 202834_at | -0.1621 | 0.6636 | |
| GSE53622 | AGT | 183 | 161062 | -0.3274 | 0.1796 | |
| GSE53624 | AGT | 183 | 161062 | 0.1002 | 0.6603 | |
| GSE63941 | AGT | 183 | 202834_at | -1.7668 | 0.0006 | |
| GSE77861 | AGT | 183 | 202834_at | 0.2491 | 0.4634 | |
| GSE97050 | AGT | 183 | A_23_P115261 | 0.4909 | 0.3417 | |
| SRP133303 | AGT | 183 | RNAseq | 0.2456 | 0.5807 | |
| SRP159526 | AGT | 183 | RNAseq | 1.3913 | 0.0519 | |
| SRP219564 | AGT | 183 | RNAseq | -0.0135 | 0.9904 | |
| TCGA | AGT | 183 | RNAseq | -0.9691 | 0.0006 |
Upregulated datasets: 0; Downregulated datasets: 1.
Survival by AGT expression:
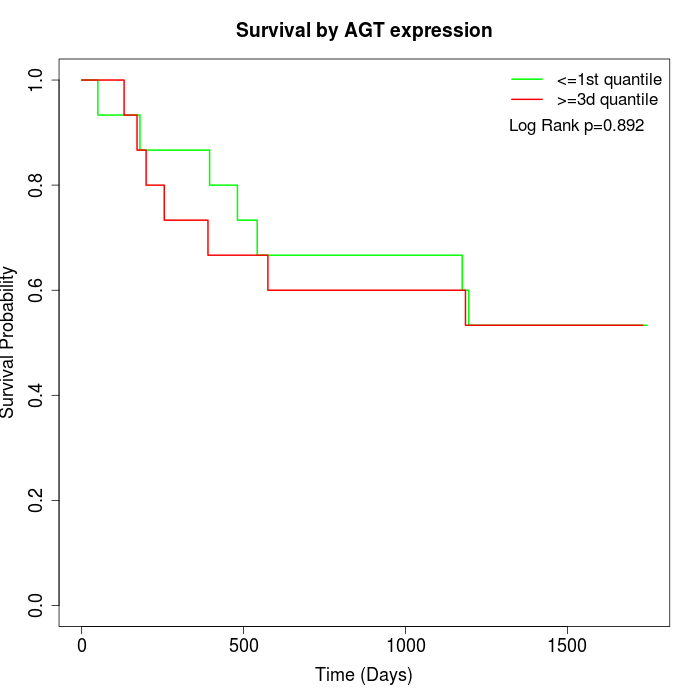 | 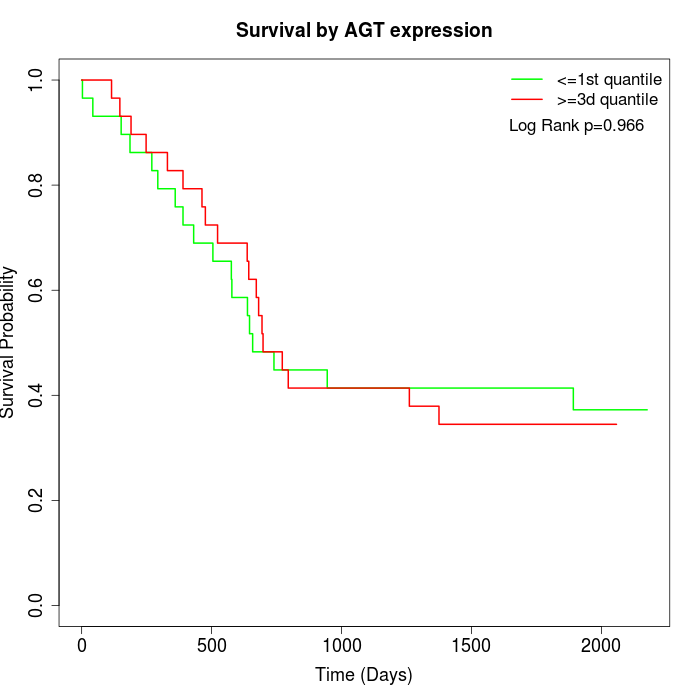 | 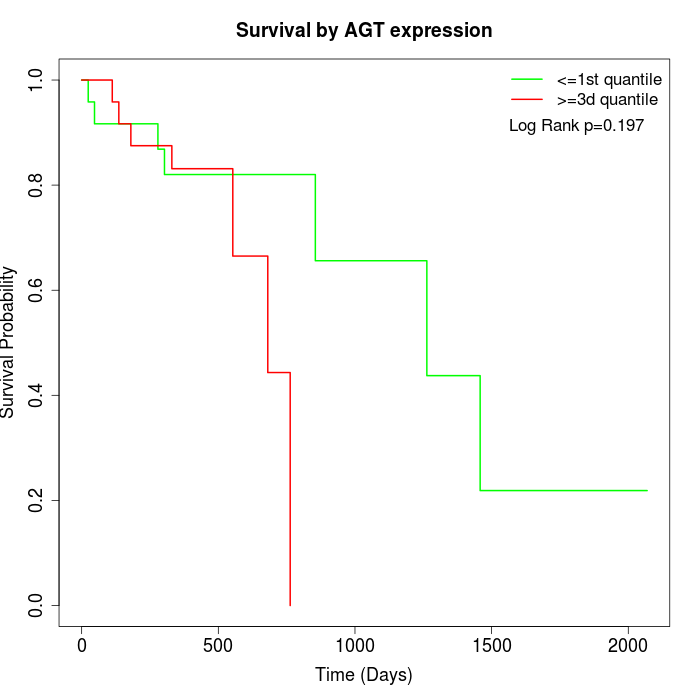 |
| GSE53622 | GSE53624 | TCGA |
Note: Click image to view full size file.
Copy number change of AGT:
| Dataset | Gene | EntrezID | Gain | Loss | Normal | Detail |
|---|---|---|---|---|---|---|
| GSE15526 | AGT | 183 | 11 | 0 | 19 | |
| GSE20123 | AGT | 183 | 11 | 0 | 19 | |
| GSE43470 | AGT | 183 | 8 | 1 | 34 | |
| GSE46452 | AGT | 183 | 4 | 2 | 53 | |
| GSE47630 | AGT | 183 | 15 | 0 | 25 | |
| GSE54993 | AGT | 183 | 0 | 6 | 64 | |
| GSE54994 | AGT | 183 | 17 | 0 | 36 | |
| GSE60625 | AGT | 183 | 0 | 0 | 11 | |
| GSE74703 | AGT | 183 | 8 | 1 | 27 | |
| GSE74704 | AGT | 183 | 5 | 0 | 15 | |
| TCGA | AGT | 183 | 45 | 3 | 48 |
Total number of gains: 124; Total number of losses: 13; Total Number of normals: 351.
Somatic mutations of AGT:
Generating mutation plots.
Highly correlated genes for AGT:
Showing top 20/563 corelated genes with mean PCC>0.5.
| Gene1 | Gene2 | Mean PCC | Num. Datasets | Num. PCC<0 | Num. PCC>0.5 |
|---|---|---|---|---|---|
| AGT | ZNF512 | 0.769144 | 3 | 0 | 3 |
| AGT | NAALAD2 | 0.742484 | 3 | 0 | 3 |
| AGT | CABYR | 0.733566 | 3 | 0 | 3 |
| AGT | USF1 | 0.723299 | 3 | 0 | 3 |
| AGT | LRRC34 | 0.720027 | 3 | 0 | 3 |
| AGT | EIF2AK4 | 0.714603 | 3 | 0 | 3 |
| AGT | TNRC18 | 0.713192 | 3 | 0 | 3 |
| AGT | CYGB | 0.711615 | 3 | 0 | 3 |
| AGT | KHDC1 | 0.708532 | 3 | 0 | 3 |
| AGT | RASSF8 | 0.708087 | 4 | 0 | 4 |
| AGT | FAN1 | 0.704679 | 3 | 0 | 3 |
| AGT | BRAT1 | 0.70282 | 3 | 0 | 3 |
| AGT | PDE8A | 0.701834 | 4 | 0 | 3 |
| AGT | ZNF490 | 0.699159 | 3 | 0 | 3 |
| AGT | MACROD2 | 0.690966 | 3 | 0 | 3 |
| AGT | DNAJB9 | 0.690082 | 4 | 0 | 4 |
| AGT | ZCCHC3 | 0.686664 | 3 | 0 | 3 |
| AGT | ITGA5 | 0.6852 | 4 | 0 | 4 |
| AGT | TCTEX1D2 | 0.685119 | 4 | 0 | 4 |
| AGT | KCNQ3 | 0.684382 | 3 | 0 | 3 |
For details and further investigation, click here