| Full name: adenosine monophosphate deaminase 1 | Alias Symbol: MAD|MADA | ||
| Type: protein-coding gene | Cytoband: 1p13.2 | ||
| Entrez ID: 270 | HGNC ID: HGNC:468 | Ensembl Gene: ENSG00000116748 | OMIM ID: 102770 |
Expression of AMPD1:
| Dataset | Gene | EntrezID | Probe | Log2FC | Adj.pValue | Expression |
|---|---|---|---|---|---|---|
| GSE17351 | AMPD1 | 270 | 206121_at | -0.4611 | 0.5452 | |
| GSE20347 | AMPD1 | 270 | 206121_at | -0.0758 | 0.3123 | |
| GSE23400 | AMPD1 | 270 | 206121_at | -0.2268 | 0.0000 | |
| GSE26886 | AMPD1 | 270 | 206121_at | -0.3739 | 0.0058 | |
| GSE29001 | AMPD1 | 270 | 206121_at | -0.3811 | 0.0198 | |
| GSE38129 | AMPD1 | 270 | 206121_at | -0.2015 | 0.0095 | |
| GSE45670 | AMPD1 | 270 | 206121_at | -0.9122 | 0.0000 | |
| GSE53622 | AMPD1 | 270 | 16435 | -0.5878 | 0.0000 | |
| GSE53624 | AMPD1 | 270 | 16435 | -0.6989 | 0.0000 | |
| GSE63941 | AMPD1 | 270 | 206121_at | 0.2375 | 0.0199 | |
| GSE77861 | AMPD1 | 270 | 206121_at | -0.1322 | 0.3344 | |
| GSE97050 | AMPD1 | 270 | A_33_P3248152 | -0.2812 | 0.7535 | |
| SRP133303 | AMPD1 | 270 | RNAseq | -2.0346 | 0.0004 | |
| SRP159526 | AMPD1 | 270 | RNAseq | 0.1447 | 0.9123 | |
| TCGA | AMPD1 | 270 | RNAseq | -2.7328 | 0.0063 |
Upregulated datasets: 0; Downregulated datasets: 2.
Survival by AMPD1 expression:
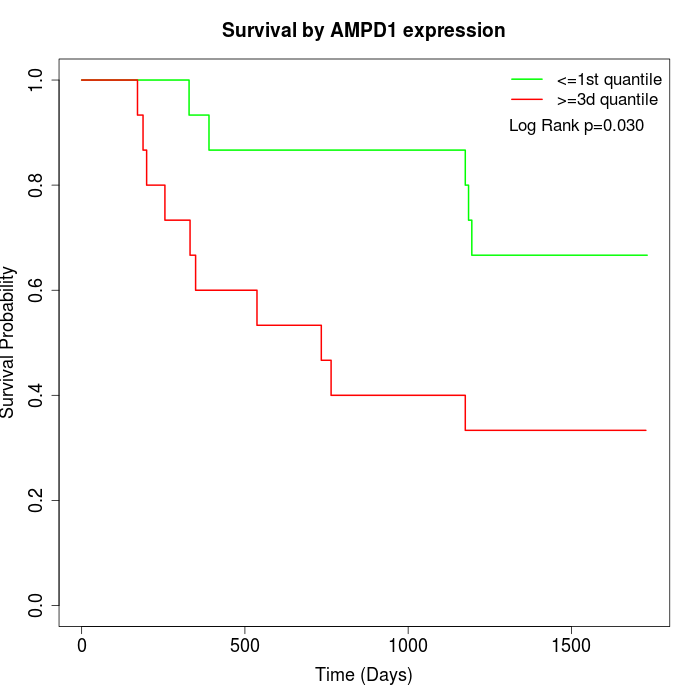 | 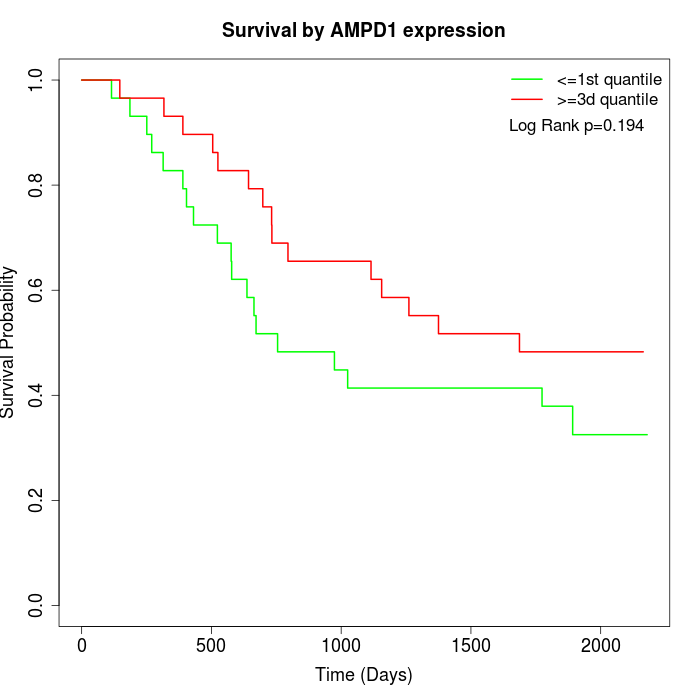 | 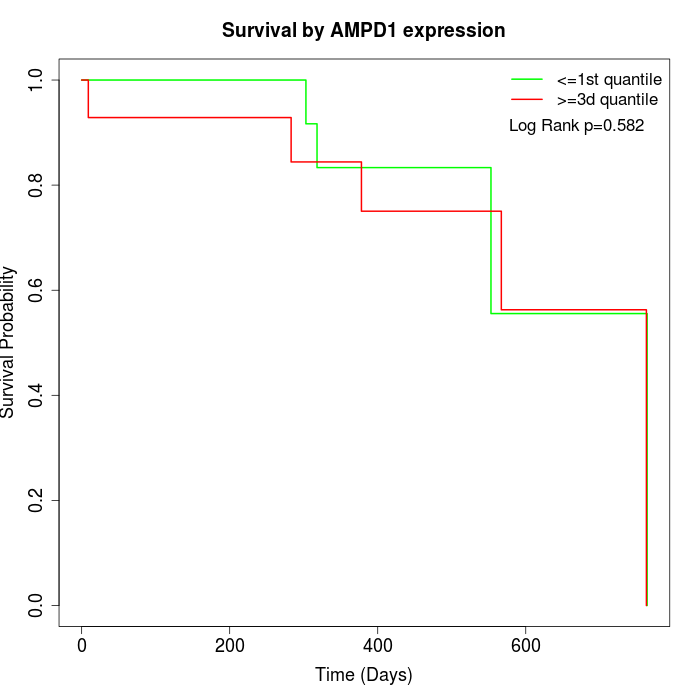 |
| GSE53622 | GSE53624 | TCGA |
Note: Click image to view full size file.
Copy number change of AMPD1:
| Dataset | Gene | EntrezID | Gain | Loss | Normal | Detail |
|---|---|---|---|---|---|---|
| GSE15526 | AMPD1 | 270 | 0 | 9 | 21 | |
| GSE20123 | AMPD1 | 270 | 0 | 9 | 21 | |
| GSE43470 | AMPD1 | 270 | 0 | 8 | 35 | |
| GSE46452 | AMPD1 | 270 | 2 | 1 | 56 | |
| GSE47630 | AMPD1 | 270 | 9 | 5 | 26 | |
| GSE54993 | AMPD1 | 270 | 0 | 1 | 69 | |
| GSE54994 | AMPD1 | 270 | 7 | 3 | 43 | |
| GSE60625 | AMPD1 | 270 | 0 | 0 | 11 | |
| GSE74703 | AMPD1 | 270 | 0 | 7 | 29 | |
| GSE74704 | AMPD1 | 270 | 0 | 5 | 15 | |
| TCGA | AMPD1 | 270 | 12 | 30 | 54 |
Total number of gains: 30; Total number of losses: 78; Total Number of normals: 380.
Somatic mutations of AMPD1:
Generating mutation plots.
Highly correlated genes for AMPD1:
Showing top 20/404 corelated genes with mean PCC>0.5.
| Gene1 | Gene2 | Mean PCC | Num. Datasets | Num. PCC<0 | Num. PCC>0.5 |
|---|---|---|---|---|---|
| AMPD1 | EPHA5 | 0.713051 | 3 | 0 | 3 |
| AMPD1 | FCRL4 | 0.69452 | 3 | 0 | 3 |
| AMPD1 | RNF17 | 0.676797 | 3 | 0 | 3 |
| AMPD1 | ZNF780A | 0.665531 | 3 | 0 | 3 |
| AMPD1 | ZNF710 | 0.663887 | 3 | 0 | 3 |
| AMPD1 | CIDEA | 0.662897 | 3 | 0 | 3 |
| AMPD1 | PRM1 | 0.660669 | 3 | 0 | 3 |
| AMPD1 | CAPN11 | 0.648491 | 5 | 0 | 4 |
| AMPD1 | ELF5 | 0.647005 | 3 | 0 | 3 |
| AMPD1 | GDF2 | 0.639051 | 3 | 0 | 3 |
| AMPD1 | SLC13A3 | 0.634765 | 4 | 0 | 3 |
| AMPD1 | GBA3 | 0.634543 | 3 | 0 | 3 |
| AMPD1 | FRMPD4 | 0.634437 | 3 | 0 | 3 |
| AMPD1 | GPR35 | 0.633479 | 4 | 0 | 4 |
| AMPD1 | SMTNL2 | 0.630708 | 4 | 0 | 3 |
| AMPD1 | KNG1 | 0.626669 | 4 | 0 | 4 |
| AMPD1 | ABCG4 | 0.626623 | 4 | 0 | 4 |
| AMPD1 | PTPRN2 | 0.62446 | 6 | 0 | 4 |
| AMPD1 | OR10H3 | 0.62429 | 3 | 0 | 3 |
| AMPD1 | OR12D2 | 0.623434 | 4 | 0 | 4 |
For details and further investigation, click here