| Full name: kininogen 1 | Alias Symbol: BK | ||
| Type: protein-coding gene | Cytoband: 3q27.3 | ||
| Entrez ID: 3827 | HGNC ID: HGNC:6383 | Ensembl Gene: ENSG00000113889 | OMIM ID: 612358 |
KNG1 involved pathways:
| KEGG pathway | Description | View |
|---|---|---|
| hsa04610 | Complement and coagulation cascades |
Expression of KNG1:
| Dataset | Gene | EntrezID | Probe | Log2FC | Adj.pValue | Expression |
|---|---|---|---|---|---|---|
| GSE17351 | KNG1 | 3827 | 217512_at | -0.0831 | 0.7140 | |
| GSE20347 | KNG1 | 3827 | 217512_at | -0.0297 | 0.7027 | |
| GSE23400 | KNG1 | 3827 | 217512_at | -0.1179 | 0.0000 | |
| GSE26886 | KNG1 | 3827 | 206054_at | 0.0833 | 0.4030 | |
| GSE29001 | KNG1 | 3827 | 217512_at | -0.1678 | 0.4107 | |
| GSE38129 | KNG1 | 3827 | 217512_at | -0.1381 | 0.0177 | |
| GSE45670 | KNG1 | 3827 | 206054_at | 0.0227 | 0.8053 | |
| GSE53622 | KNG1 | 3827 | 36111 | -0.3553 | 0.0042 | |
| GSE53624 | KNG1 | 3827 | 36111 | -0.3774 | 0.0001 | |
| GSE63941 | KNG1 | 3827 | 206054_at | 0.2315 | 0.1140 | |
| GSE77861 | KNG1 | 3827 | 217512_at | -0.0997 | 0.2564 | |
| TCGA | KNG1 | 3827 | RNAseq | 1.3445 | 0.3202 |
Upregulated datasets: 0; Downregulated datasets: 0.
Survival by KNG1 expression:
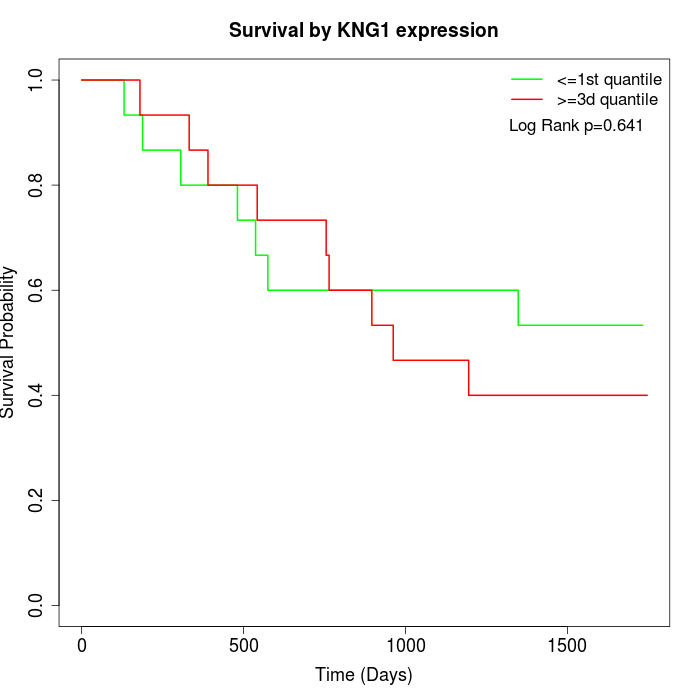 | 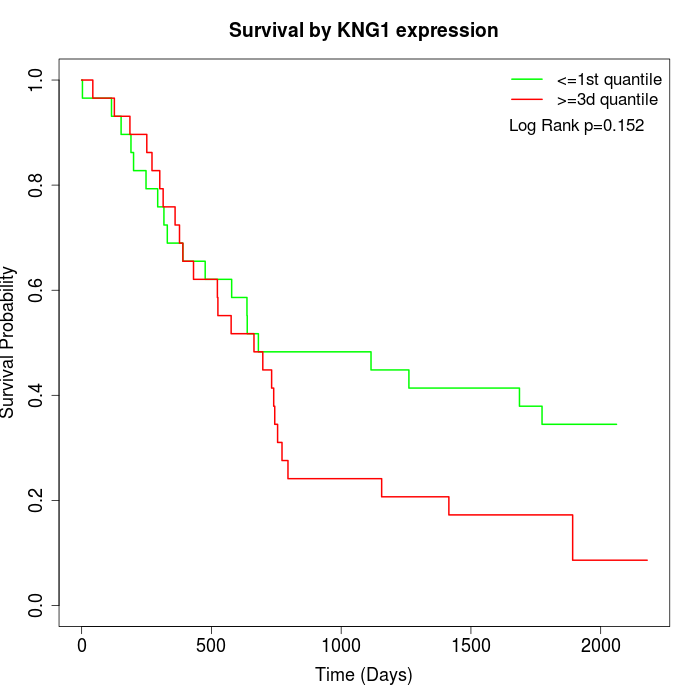 | 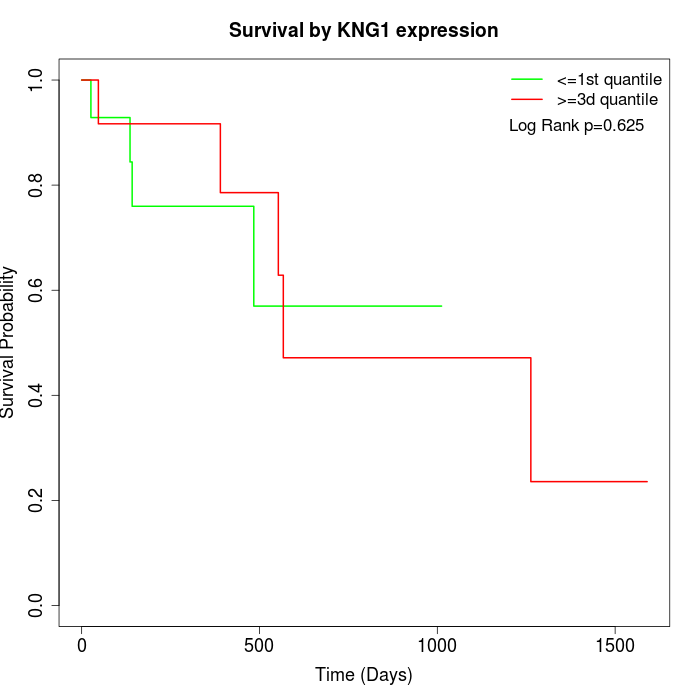 |
| GSE53622 | GSE53624 | TCGA |
Note: Click image to view full size file.
Copy number change of KNG1:
| Dataset | Gene | EntrezID | Gain | Loss | Normal | Detail |
|---|---|---|---|---|---|---|
| GSE15526 | KNG1 | 3827 | 24 | 0 | 6 | |
| GSE20123 | KNG1 | 3827 | 24 | 0 | 6 | |
| GSE43470 | KNG1 | 3827 | 23 | 0 | 20 | |
| GSE46452 | KNG1 | 3827 | 19 | 1 | 39 | |
| GSE47630 | KNG1 | 3827 | 27 | 2 | 11 | |
| GSE54993 | KNG1 | 3827 | 1 | 19 | 50 | |
| GSE54994 | KNG1 | 3827 | 40 | 0 | 13 | |
| GSE60625 | KNG1 | 3827 | 0 | 6 | 5 | |
| GSE74703 | KNG1 | 3827 | 20 | 0 | 16 | |
| GSE74704 | KNG1 | 3827 | 16 | 0 | 4 | |
| TCGA | KNG1 | 3827 | 77 | 0 | 19 |
Total number of gains: 271; Total number of losses: 28; Total Number of normals: 189.
Somatic mutations of KNG1:
Generating mutation plots.
Highly correlated genes for KNG1:
Showing top 20/448 corelated genes with mean PCC>0.5.
| Gene1 | Gene2 | Mean PCC | Num. Datasets | Num. PCC<0 | Num. PCC>0.5 |
|---|---|---|---|---|---|
| KNG1 | CBLN1 | 0.69595 | 4 | 0 | 4 |
| KNG1 | CCDC33 | 0.676223 | 4 | 0 | 4 |
| KNG1 | LPO | 0.671649 | 3 | 0 | 3 |
| KNG1 | NPY2R | 0.664924 | 5 | 0 | 4 |
| KNG1 | OR10H3 | 0.656208 | 4 | 0 | 4 |
| KNG1 | SLC10A1 | 0.655682 | 5 | 0 | 5 |
| KNG1 | CLC | 0.653526 | 3 | 0 | 3 |
| KNG1 | EDDM3A | 0.65333 | 3 | 0 | 3 |
| KNG1 | TBX10 | 0.650343 | 5 | 0 | 5 |
| KNG1 | ITGA10 | 0.648971 | 4 | 0 | 4 |
| KNG1 | A4GNT | 0.64413 | 4 | 0 | 3 |
| KNG1 | AKAP6 | 0.642144 | 4 | 0 | 4 |
| KNG1 | ZNF460 | 0.638796 | 4 | 0 | 4 |
| KNG1 | DRD2 | 0.638135 | 5 | 0 | 4 |
| KNG1 | ALK | 0.636489 | 3 | 0 | 3 |
| KNG1 | SGK2 | 0.633861 | 5 | 0 | 3 |
| KNG1 | CACFD1 | 0.633815 | 5 | 0 | 4 |
| KNG1 | VIPR2 | 0.6333 | 5 | 0 | 5 |
| KNG1 | PRODH2 | 0.63176 | 5 | 0 | 4 |
| KNG1 | FOXO4 | 0.63034 | 3 | 0 | 3 |
For details and further investigation, click here