| Full name: EPH receptor A5 | Alias Symbol: Hek7|TYRO4|CEK7|EHK1 | ||
| Type: protein-coding gene | Cytoband: 4q13.1-q13.2 | ||
| Entrez ID: 2044 | HGNC ID: HGNC:3389 | Ensembl Gene: ENSG00000145242 | OMIM ID: 600004 |
| Related drugs: VANDETANIB... [more] | |||
EPHA5 involved pathways:
| KEGG pathway | Description | View |
|---|---|---|
| hsa04360 | Axon guidance |
Expression of EPHA5:
| Dataset | Gene | EntrezID | Probe | Log2FC | Adj.pValue | Expression |
|---|---|---|---|---|---|---|
| GSE17351 | EPHA5 | 2044 | 216837_at | 0.0204 | 0.9546 | |
| GSE20347 | EPHA5 | 2044 | 216837_at | 0.0685 | 0.5124 | |
| GSE23400 | EPHA5 | 2044 | 216837_at | -0.1312 | 0.0001 | |
| GSE26886 | EPHA5 | 2044 | 216837_at | -0.0699 | 0.5047 | |
| GSE29001 | EPHA5 | 2044 | 216837_at | -0.2402 | 0.0471 | |
| GSE38129 | EPHA5 | 2044 | 216837_at | -0.0401 | 0.7562 | |
| GSE45670 | EPHA5 | 2044 | 216837_at | 0.0163 | 0.8623 | |
| GSE53622 | EPHA5 | 2044 | 4118 | -0.9202 | 0.0000 | |
| GSE53624 | EPHA5 | 2044 | 4118 | -0.4018 | 0.0054 | |
| GSE63941 | EPHA5 | 2044 | 216837_at | 0.1200 | 0.5324 | |
| GSE77861 | EPHA5 | 2044 | 216837_at | -0.0049 | 0.9653 | |
| TCGA | EPHA5 | 2044 | RNAseq | -3.0949 | 0.0000 |
Upregulated datasets: 0; Downregulated datasets: 1.
Survival by EPHA5 expression:
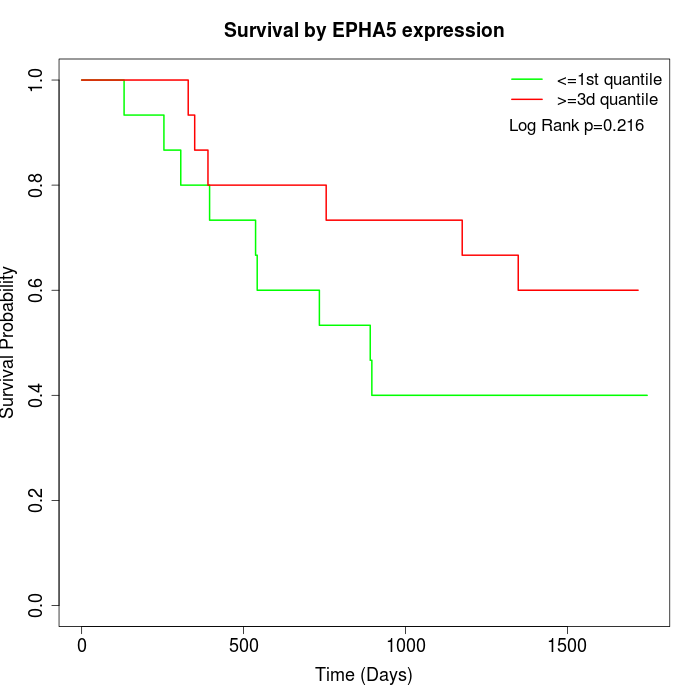 | 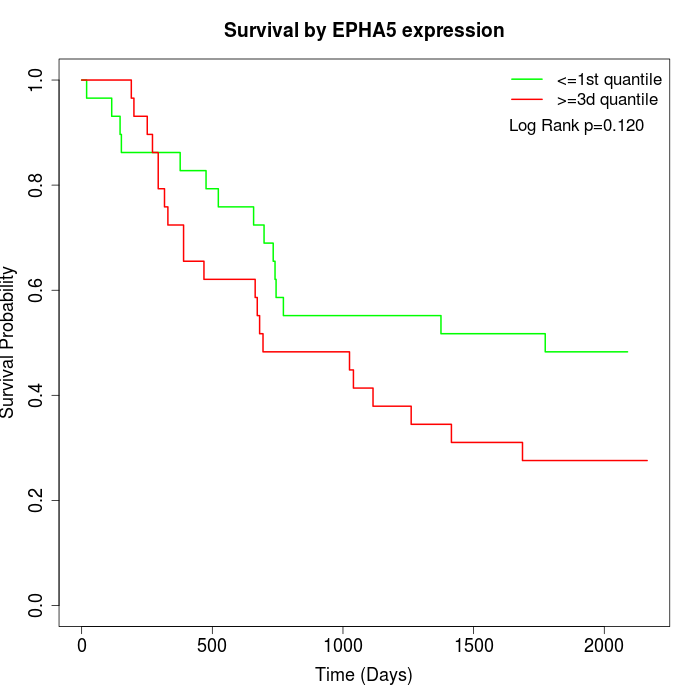 | 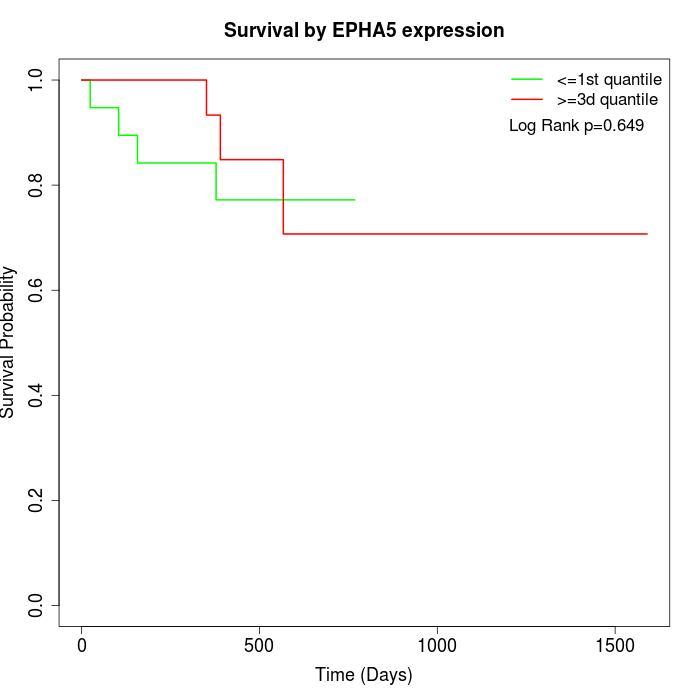 |
| GSE53622 | GSE53624 | TCGA |
Note: Click image to view full size file.
Copy number change of EPHA5:
| Dataset | Gene | EntrezID | Gain | Loss | Normal | Detail |
|---|---|---|---|---|---|---|
| GSE15526 | EPHA5 | 2044 | 0 | 13 | 17 | |
| GSE20123 | EPHA5 | 2044 | 0 | 13 | 17 | |
| GSE43470 | EPHA5 | 2044 | 1 | 15 | 27 | |
| GSE46452 | EPHA5 | 2044 | 2 | 35 | 22 | |
| GSE47630 | EPHA5 | 2044 | 0 | 19 | 21 | |
| GSE54993 | EPHA5 | 2044 | 7 | 0 | 63 | |
| GSE54994 | EPHA5 | 2044 | 1 | 9 | 43 | |
| GSE60625 | EPHA5 | 2044 | 0 | 0 | 11 | |
| GSE74703 | EPHA5 | 2044 | 1 | 13 | 22 | |
| GSE74704 | EPHA5 | 2044 | 0 | 8 | 12 | |
| TCGA | EPHA5 | 2044 | 17 | 26 | 53 |
Total number of gains: 29; Total number of losses: 151; Total Number of normals: 308.
Somatic mutations of EPHA5:
Generating mutation plots.
Highly correlated genes for EPHA5:
Showing top 20/838 corelated genes with mean PCC>0.5.
| Gene1 | Gene2 | Mean PCC | Num. Datasets | Num. PCC<0 | Num. PCC>0.5 |
|---|---|---|---|---|---|
| EPHA5 | SLC6A5 | 0.739626 | 5 | 0 | 5 |
| EPHA5 | HLA-DOA | 0.737148 | 4 | 0 | 4 |
| EPHA5 | EDA2R | 0.733062 | 5 | 0 | 5 |
| EPHA5 | SLC22A13 | 0.715514 | 4 | 0 | 4 |
| EPHA5 | AMPD1 | 0.713051 | 3 | 0 | 3 |
| EPHA5 | ACKR2 | 0.710306 | 5 | 0 | 4 |
| EPHA5 | NOS1 | 0.710095 | 5 | 0 | 4 |
| EPHA5 | BTN1A1 | 0.710033 | 4 | 0 | 4 |
| EPHA5 | GRID2 | 0.70983 | 3 | 0 | 3 |
| EPHA5 | PAX3 | 0.702271 | 3 | 0 | 3 |
| EPHA5 | SST | 0.701136 | 3 | 0 | 3 |
| EPHA5 | SIGLEC6 | 0.699023 | 4 | 0 | 4 |
| EPHA5 | PSG9 | 0.698477 | 3 | 0 | 3 |
| EPHA5 | HHLA1 | 0.696936 | 4 | 0 | 4 |
| EPHA5 | KHDRBS2 | 0.694817 | 5 | 0 | 5 |
| EPHA5 | GABRR2 | 0.694624 | 4 | 0 | 4 |
| EPHA5 | SLC10A1 | 0.692368 | 4 | 0 | 4 |
| EPHA5 | BCAN | 0.689362 | 6 | 0 | 5 |
| EPHA5 | CBL | 0.688812 | 4 | 0 | 4 |
| EPHA5 | NCR1 | 0.688795 | 4 | 0 | 4 |
For details and further investigation, click here