| Full name: FOS like 1, AP-1 transcription factor subunit | Alias Symbol: fra-1 | ||
| Type: protein-coding gene | Cytoband: 11q13.1 | ||
| Entrez ID: 8061 | HGNC ID: HGNC:13718 | Ensembl Gene: ENSG00000175592 | OMIM ID: 136515 |
| Related drugs: PHORBOL MYRISTATE ACETATE... [more] | |||
Screen Evidence:
| |||
FOSL1 involved pathways:
| KEGG pathway | Description | View |
|---|---|---|
| hsa04310 | Wnt signaling pathway | |
| hsa04380 | Osteoclast differentiation |
Expression of FOSL1:
| Dataset | Gene | EntrezID | Probe | Log2FC | Adj.pValue | Expression |
|---|---|---|---|---|---|---|
| GSE17351 | FOSL1 | 8061 | 204420_at | 0.6107 | 0.7346 | |
| GSE20347 | FOSL1 | 8061 | 204420_at | 0.5510 | 0.2794 | |
| GSE23400 | FOSL1 | 8061 | 204420_at | 0.1531 | 0.3975 | |
| GSE26886 | FOSL1 | 8061 | 204420_at | 1.4831 | 0.0029 | |
| GSE29001 | FOSL1 | 8061 | 204420_at | 0.1729 | 0.7262 | |
| GSE38129 | FOSL1 | 8061 | 204420_at | 0.7123 | 0.0646 | |
| GSE45670 | FOSL1 | 8061 | 204420_at | 0.5803 | 0.1917 | |
| GSE53622 | FOSL1 | 8061 | 90921 | 0.3883 | 0.2190 | |
| GSE53624 | FOSL1 | 8061 | 90921 | 0.4962 | 0.0123 | |
| GSE63941 | FOSL1 | 8061 | 204420_at | 0.4270 | 0.7313 | |
| GSE77861 | FOSL1 | 8061 | 204420_at | 1.1811 | 0.0468 | |
| GSE97050 | FOSL1 | 8061 | A_23_P161624 | 1.7900 | 0.0556 | |
| SRP007169 | FOSL1 | 8061 | RNAseq | 1.2779 | 0.0056 | |
| SRP008496 | FOSL1 | 8061 | RNAseq | 1.0651 | 0.0045 | |
| SRP064894 | FOSL1 | 8061 | RNAseq | -0.6974 | 0.1440 | |
| SRP133303 | FOSL1 | 8061 | RNAseq | 0.8812 | 0.1053 | |
| SRP193095 | FOSL1 | 8061 | RNAseq | 1.1779 | 0.0068 | |
| SRP219564 | FOSL1 | 8061 | RNAseq | 0.2406 | 0.7073 | |
| TCGA | FOSL1 | 8061 | RNAseq | 0.4644 | 0.0018 |
Upregulated datasets: 5; Downregulated datasets: 0.
Survival by FOSL1 expression:
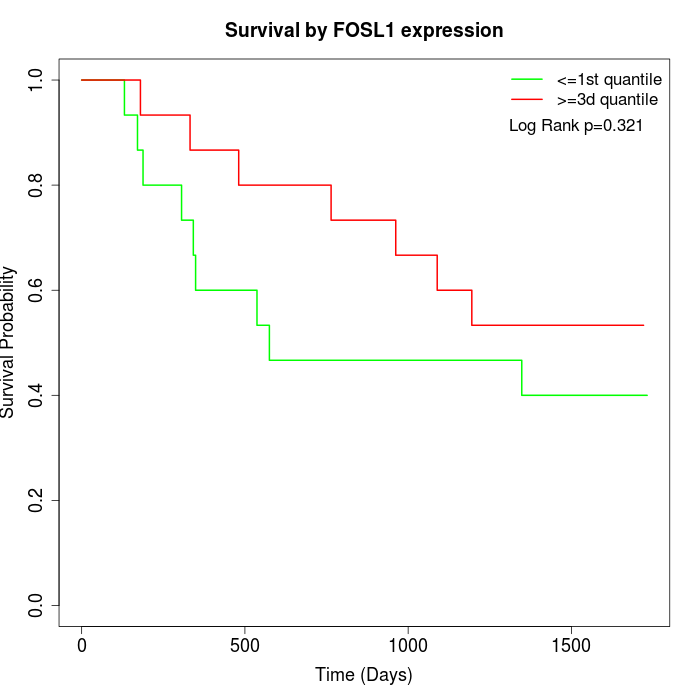 | 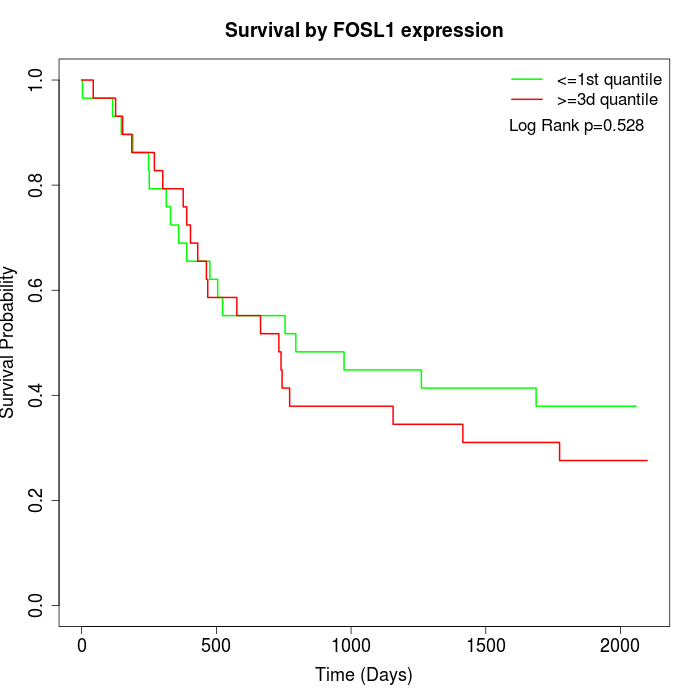 | 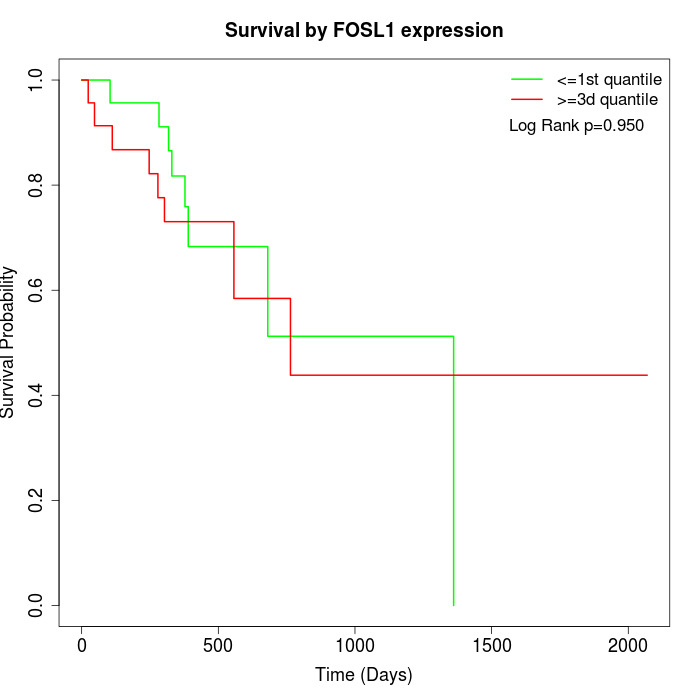 |
| GSE53622 | GSE53624 | TCGA |
Note: Click image to view full size file.
Copy number change of FOSL1:
| Dataset | Gene | EntrezID | Gain | Loss | Normal | Detail |
|---|---|---|---|---|---|---|
| GSE15526 | FOSL1 | 8061 | 8 | 5 | 17 | |
| GSE20123 | FOSL1 | 8061 | 8 | 5 | 17 | |
| GSE43470 | FOSL1 | 8061 | 6 | 1 | 36 | |
| GSE46452 | FOSL1 | 8061 | 11 | 3 | 45 | |
| GSE47630 | FOSL1 | 8061 | 7 | 5 | 28 | |
| GSE54993 | FOSL1 | 8061 | 3 | 0 | 67 | |
| GSE54994 | FOSL1 | 8061 | 7 | 5 | 41 | |
| GSE60625 | FOSL1 | 8061 | 0 | 3 | 8 | |
| GSE74703 | FOSL1 | 8061 | 4 | 0 | 32 | |
| GSE74704 | FOSL1 | 8061 | 6 | 3 | 11 | |
| TCGA | FOSL1 | 8061 | 23 | 7 | 66 |
Total number of gains: 83; Total number of losses: 37; Total Number of normals: 368.
Somatic mutations of FOSL1:
Generating mutation plots.
Highly correlated genes for FOSL1:
Showing top 20/457 corelated genes with mean PCC>0.5.
| Gene1 | Gene2 | Mean PCC | Num. Datasets | Num. PCC<0 | Num. PCC>0.5 |
|---|---|---|---|---|---|
| FOSL1 | AP2B1 | 0.787689 | 3 | 0 | 3 |
| FOSL1 | MMP2 | 0.773293 | 3 | 0 | 3 |
| FOSL1 | XPR1 | 0.743335 | 4 | 0 | 4 |
| FOSL1 | COL6A2 | 0.728789 | 3 | 0 | 3 |
| FOSL1 | RAVER1 | 0.714029 | 3 | 0 | 3 |
| FOSL1 | SPATS2 | 0.709139 | 3 | 0 | 3 |
| FOSL1 | CPNE2 | 0.708201 | 3 | 0 | 3 |
| FOSL1 | PLXND1 | 0.702728 | 3 | 0 | 3 |
| FOSL1 | CDH11 | 0.700839 | 3 | 0 | 3 |
| FOSL1 | MMD | 0.69396 | 3 | 0 | 3 |
| FOSL1 | LPCAT2 | 0.688138 | 3 | 0 | 3 |
| FOSL1 | CDCA2 | 0.686624 | 3 | 0 | 3 |
| FOSL1 | COL6A3 | 0.68568 | 3 | 0 | 3 |
| FOSL1 | MSANTD3 | 0.683501 | 3 | 0 | 3 |
| FOSL1 | SLAMF9 | 0.678035 | 3 | 0 | 3 |
| FOSL1 | CHN1 | 0.672262 | 3 | 0 | 3 |
| FOSL1 | QRFPR | 0.671604 | 3 | 0 | 3 |
| FOSL1 | CHST11 | 0.67054 | 4 | 0 | 3 |
| FOSL1 | HYAL3 | 0.669992 | 3 | 0 | 3 |
| FOSL1 | HES6 | 0.666721 | 3 | 0 | 3 |
For details and further investigation, click here